EX-99.1
Published on October 4, 2021
Exhibit 99.1 INVESTOR ENGAGEMENT October 2021 Inspired Packaging. A World of Difference.
FORWARD LOOKING STATEMENTS CAUTIONARY STATEMENT REGARDING FORWARD-LOOKING STATEMENTS Any statements of the Company's expectations in these slides, including but not limited to the intent and timing to acquire AR Packaging, proforma European sales of the combined entity, expected synergies from the AR Packaging acquisition and tonnage to be consumed, constitute forward-looking statements as defined in the Private Securities Litigation Reform Act of 1995. Such statements are based on currently available information and are subject to various risks and uncertainties that could cause actual results to differ materially from the Company's present expectations. These risks and uncertainties include, but are not limited to, the effects of the Covid-19 pandemic on the Company’s operations and demand for its products, inflation of and volatility in raw material and energy costs, continuing pressure for lower cost products, the Company’s ability to implement its business strategies, including productivity initiatives, cost reduction plans, and integration activities, as well as the Company’s debt level, currency movements and other risks of conducting business internationally and the impact of regulatory and litigation matters, including the continued availability of the Company’s U.S. federal income tax attributes to offset U.S. federal income taxes and the timing related to the Company’s future U.S. federal income tax payments. Undue reliance should not be placed on such forward-looking statements, as such statements speak only as of the date on which they are made and the Company undertakes no obligation to update such statements, except as required by law. Additional information regarding these and other risks is contained in the Company's periodic filings with the SEC. NON-GAAP FINANCIAL MEASURES This presentation includes certain financial measures that exclude or adjust for charges or income associated with business combinations, facility shutdowns, extended mill outages, sales of assets and other special charges or income. The Company’s management believes that the presentation of these financial measures provides useful information to investors because these measures are regularly used by management in assessing the Company’s performance. These financial measures are not calculated in accordance with generally accepted accounting principles in the United States (“GAAP”) and should be considered in addition to results prepared in accordance with GAAP, but should not be considered substitutes for or superior to GAAP results. In addition, these non-GAAP financial measures may not be comparable to similarly-titled measures utilized by other companies, since such other companies may not calculate such measure in the same manner as we do. A reconciliation of these measures to the most relevant GAAP measure is available in our latest earnings press release which can be found in the Investors section on the Graphic Packaging website at www.graphicpkg.com. 2 ©2021 Graphic Packaging International
AGENDA Graphic Packaging Today Our Role in Driving a More Sustainable Future Positioned to Deliver Stakeholder Value ESG Leadership Core to Business Engaged Board with Strong Governance Practices 3 ©2021 Graphic Packaging International
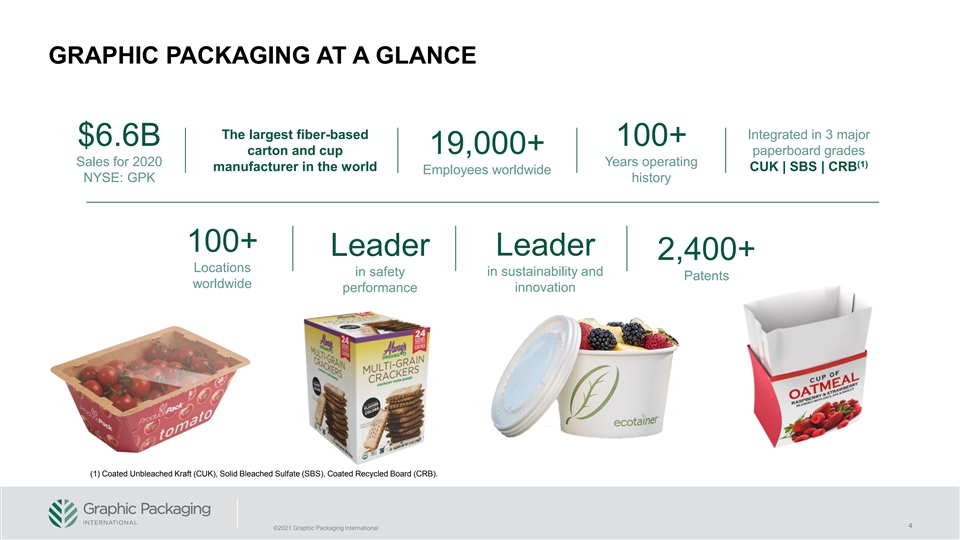
GRAPHIC PACKAGING AT A GLANCE The largest fiber-based Integrated in 3 major $6.6B 100+ 19,000+ carton and cup paperboard grades Sales for 2020 Years operating (1) manufacturer in the world CUK | SBS | CRB Employees worldwide NYSE: GPK history 100+ Leader Leader 2,400+ Locations in safety in sustainability and Patents worldwide performance innovation (1) Coated Unbleached Kraft (CUK), Solid Bleached Sulfate (SBS), Coated Recycled Board (CRB). 4 ©2021 Graphic Packaging International
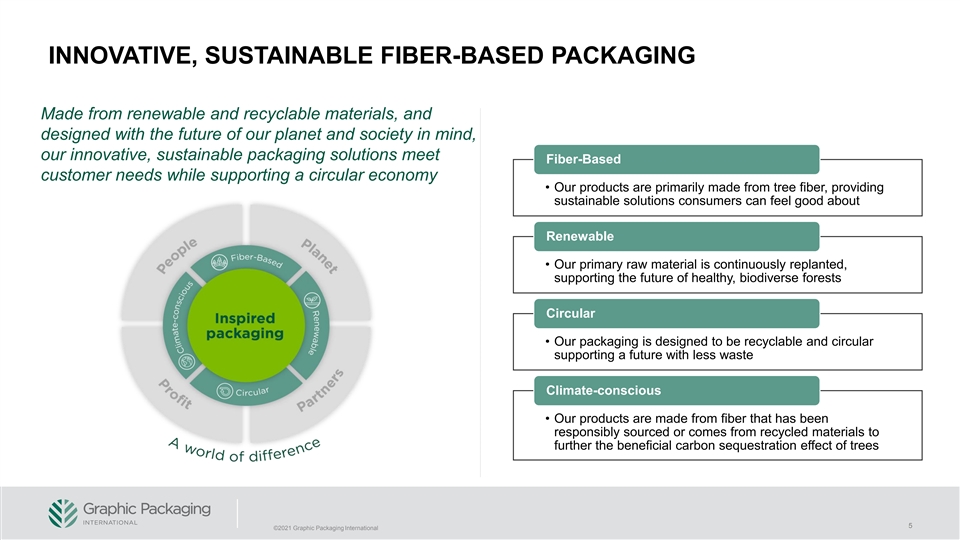
INNOVATIVE, SUSTAINABLE FIBER-BASED PACKAGING Made from renewable and recyclable materials, and designed with the future of our planet and society in mind, our innovative, sustainable packaging solutions meet Fiber-Based customer needs while supporting a circular economy Inspired by consumers and the • Our products are primarily made from tree fiber, providing ever-evolving world around us, sustainable solutions consumers can feel good about we create innovative, fiber- based packaging solutions Renewable designed with the future of the planet in mind. • Our primary raw material is continuously replanted, supporting the future of healthy, biodiverse forests Circular • Our packaging is designed to be recyclable and circular supporting a future with less waste Climate-conscious • Our products are made from fiber that has been responsibly sourced or comes from recycled materials to further the beneficial carbon sequestration effect of trees 5 ©2021 Graphic Packaging International
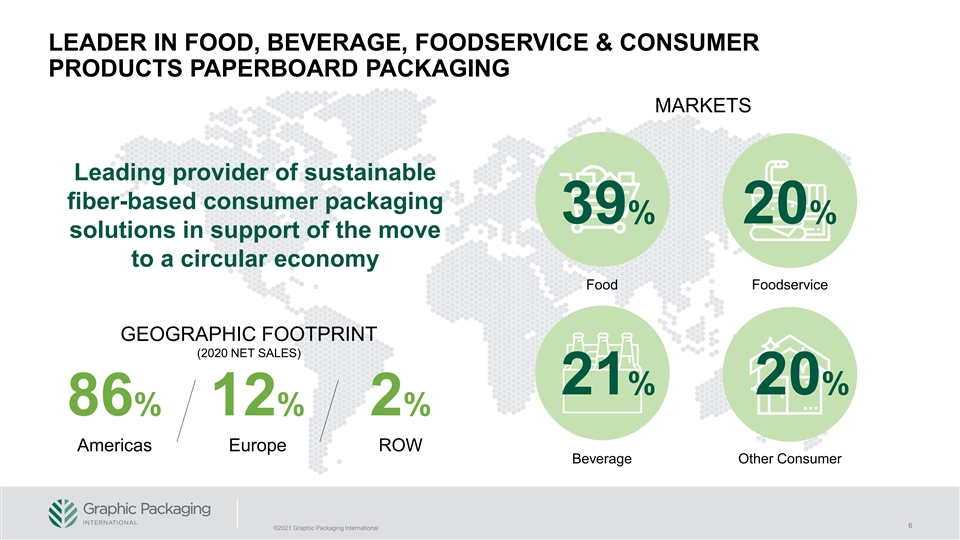
LEADER IN FOOD, BEVERAGE, FOODSERVICE & CONSUMER PRODUCTS PAPERBOARD PACKAGING MARKETS Leading provider of sustainable fiber-based consumer packaging 39% 20% solutions in support of the move to a circular economy Food Foodservice GEOGRAPHIC FOOTPRINT (2020 NET SALES) 21% 20% 86% 12% 2% Americas Europe ROW Beverage Other Consumer 6 ©2021 Graphic Packaging International
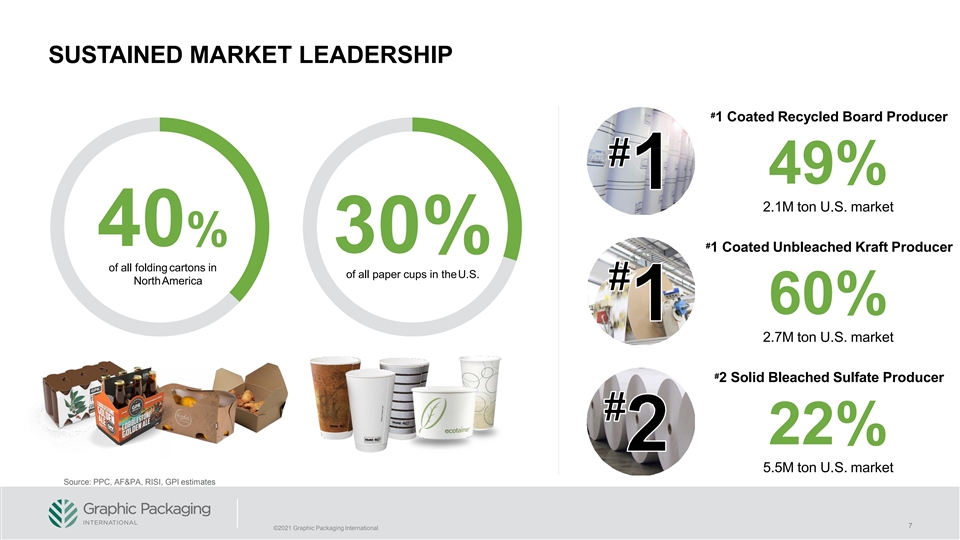
SUSTAINED MARKET LEADERSHIP # 1 Coated Recycled Board Producer 49% 2.1M ton U.S. market 40% # 1 Coated Unbleached Kraft Producer 30% of all folding cartons in of all paper cups in theU.S. NorthAmerica 60% 2.7M ton U.S. market # 2 Solid Bleached Sulfate Producer 22% 5.5M ton U.S. market Source: PPC, AF&PA, RISI, GPI estimates 7 ©2021 Graphic Packaging International
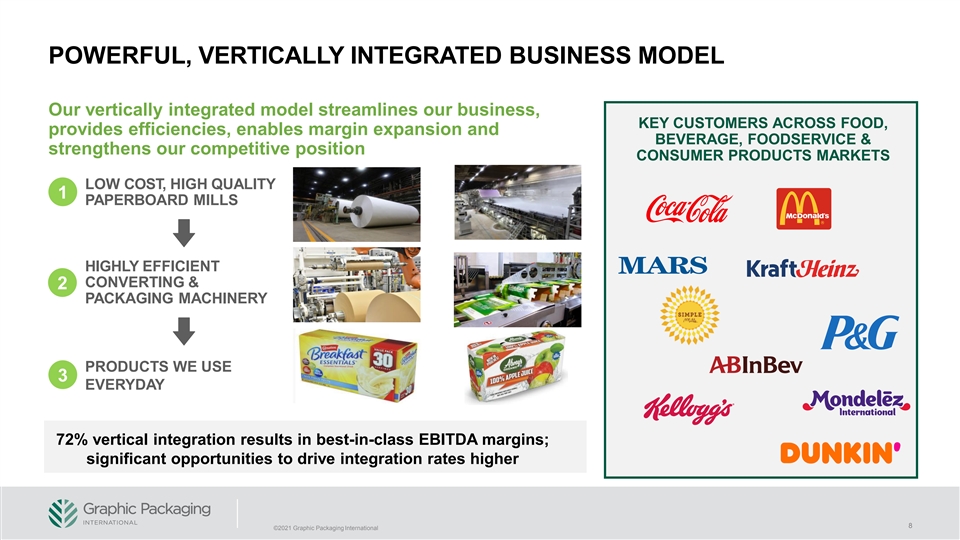
POWERFUL, VERTICALLY INTEGRATED BUSINESS MODEL Our vertically integrated model streamlines our business, KEY CUSTOMERS ACROSS FOOD, provides efficiencies, enables margin expansion and BEVERAGE, FOODSERVICE & strengthens our competitive position CONSUMER PRODUCTS MARKETS LOW COST, HIGH QUALITY 1 PAPERBOARD MILLS HIGHLY EFFICIENT CONVERTING & 2 PACKAGING MACHINERY PRODUCTS WE USE 3 EVERYDAY 72% vertical integration results in best-in-class EBITDA margins; significant opportunities to drive integration rates higher 8 ©2021 Graphic Packaging International
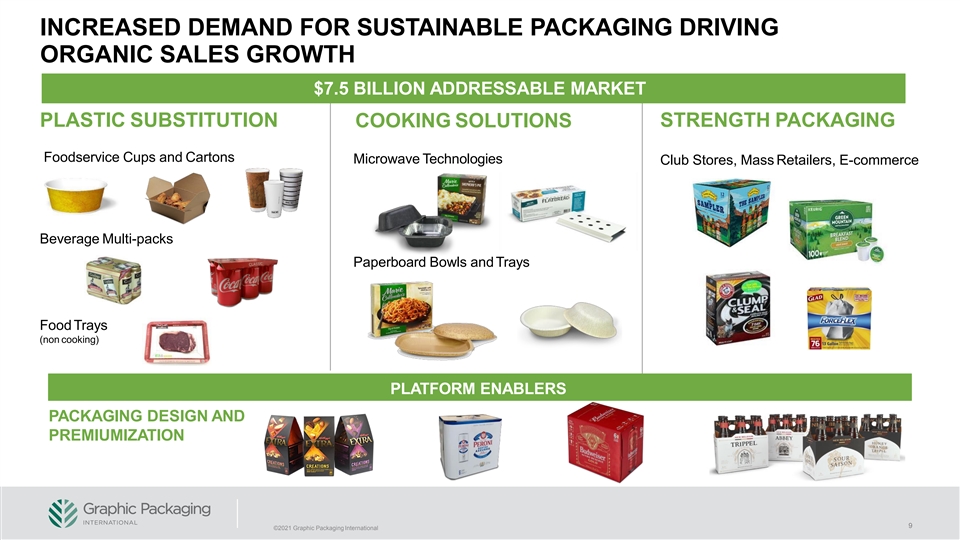
INCREASED DEMAND FOR SUSTAINABLE PACKAGING DRIVING ORGANIC SALES GROWTH $7.5 BILLION ADDRESSABLE MARKET PLASTIC SUBSTITUTION COOKING SOLUTIONS STRENGTH PACKAGING Foodservice Cups and Cartons Microwave Technologies Club Stores, Mass Retailers, E-commerce Beverage Multi-packs Paperboard Bowls andTrays Food Trays (non cooking) PLATFORM ENABLERS PACKAGING DESIGN AND PREMIUMIZATION 9 ©2021 Graphic Packaging International
AGENDA Graphic Packaging Today Our Role in Driving a More Sustainable Future Positioned to Deliver Stakeholder Value ESG Leadership Core to Business Engaged Board with Strong Governance Practices 10 ©2021 Graphic Packaging International
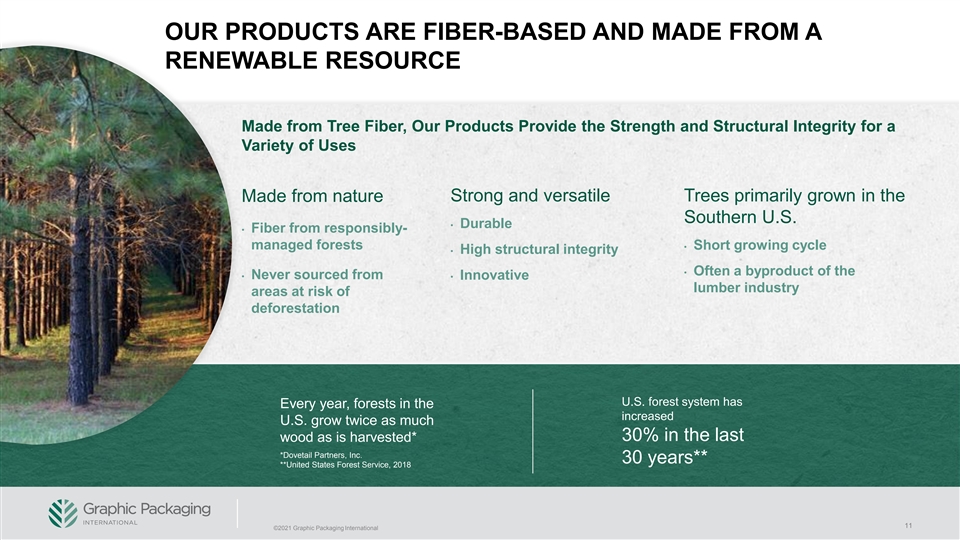
OUR PRODUCTS ARE FIBER-BASED AND MADE FROM A RENEWABLE RESOURCE Made from Tree Fiber, Our Products Provide the Strength and Structural Integrity for a Variety of Uses Made from nature Strong and versatile Trees primarily grown in the Southern U.S. • Durable • Fiber from responsibly- managed forests • Short growing cycle • High structural integrity • Often a byproduct of the • Never sourced from • Innovative lumber industry areas at risk of deforestation U.S. forest system has Every year, forests in the increased U.S. grow twice as much 30% in the last wood as is harvested* *Dovetail Partners, Inc. 30 years** **United States Forest Service, 2018 11 ©2021 Graphic Packaging International
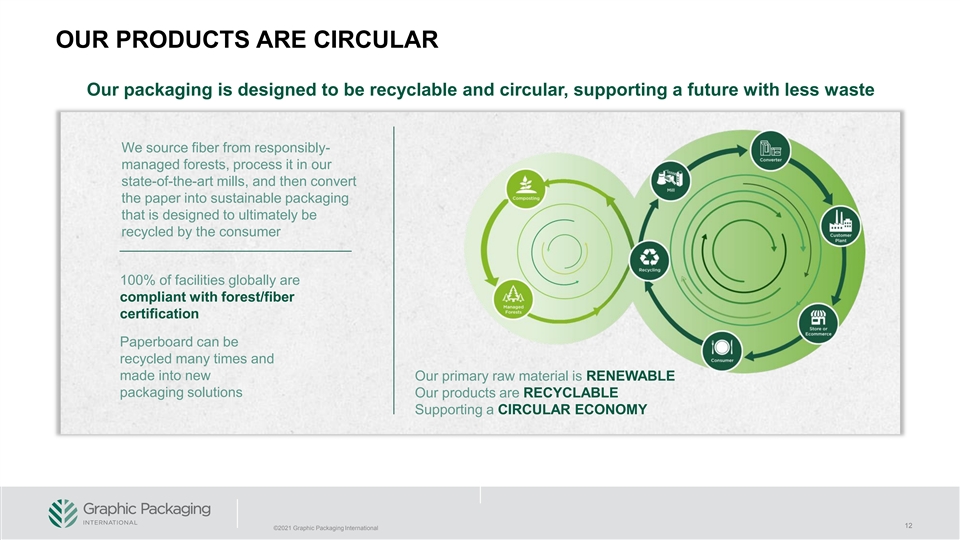
OUR PRODUCTS ARE CIRCULAR Our packaging is designed to be recyclable and circular, supporting a future with less waste We source fiber from responsibly- managed forests, process it in our state-of-the-art mills, and then convert the paper into sustainable packaging that is designed to ultimately be recycled by the consumer 100% of facilities globally are compliant with forest/fiber certification Paperboard can be recycled many times and made into new Our primary raw material is RENEWABLE packaging solutions Our products are RECYCLABLE Supporting a CIRCULAR ECONOMY 12 ©2021 Graphic Packaging International
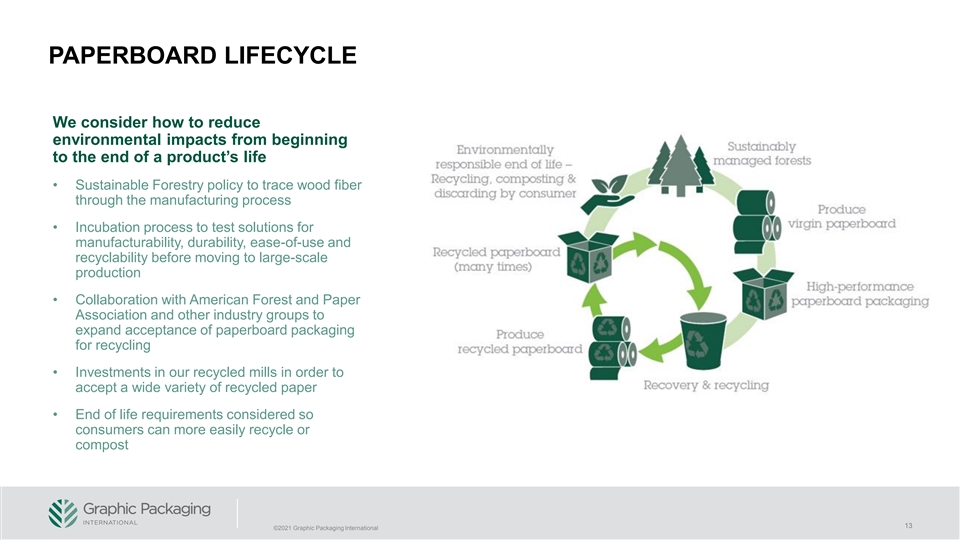
PAPERBOARD LIFECYCLE We consider how to reduce environmental impacts from beginning to the end of a product’s life • Sustainable Forestry policy to trace wood fiber through the manufacturing process • Incubation process to test solutions for manufacturability, durability, ease-of-use and recyclability before moving to large-scale production • Collaboration with American Forest and Paper Association and other industry groups to expand acceptance of paperboard packaging for recycling • Investments in our recycled mills in order to accept a wide variety of recycled paper • End of life requirements considered so consumers can more easily recycle or compost 13 ©2021 Graphic Packaging International
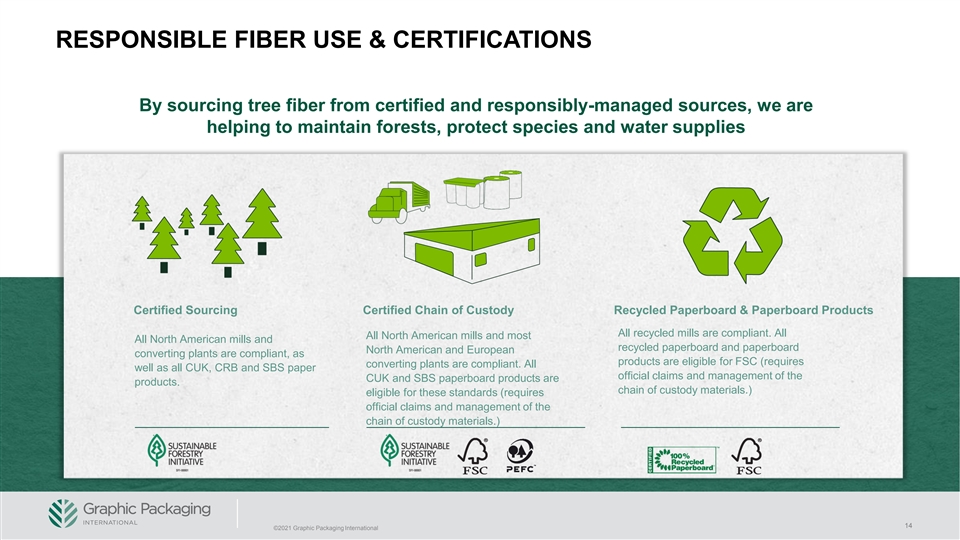
RESPONSIBLE FIBER USE & CERTIFICATIONS By sourcing tree fiber from certified and responsibly-managed sources, we are helping to maintain forests, protect species and water supplies 100% of facilities globally are compliant with forest/fiber Certification Certified Sourcing Certified Chain of Custody Recycled Paperboard & Paperboard Products All recycled mills are compliant. All All North American mills and most All North American mills and recycled paperboard and paperboard North American and European converting plants are compliant, as products are eligible for FSC (requires converting plants are compliant. All well as all CUK, CRB and SBS paper official claims and management of the CUK and SBS paperboard products are products. chain of custody materials.) eligible for these standards (requires official claims and management of the chain of custody materials.) 14 ©2021 Graphic Packaging International
AGENDA Graphic Packaging Today Our Role in Driving a More Sustainable Future Positioned to Deliver Stakeholder Value ESG Leadership Core to Business Engaged Board with Strong Governance Practices 15 ©2021 Graphic Packaging International
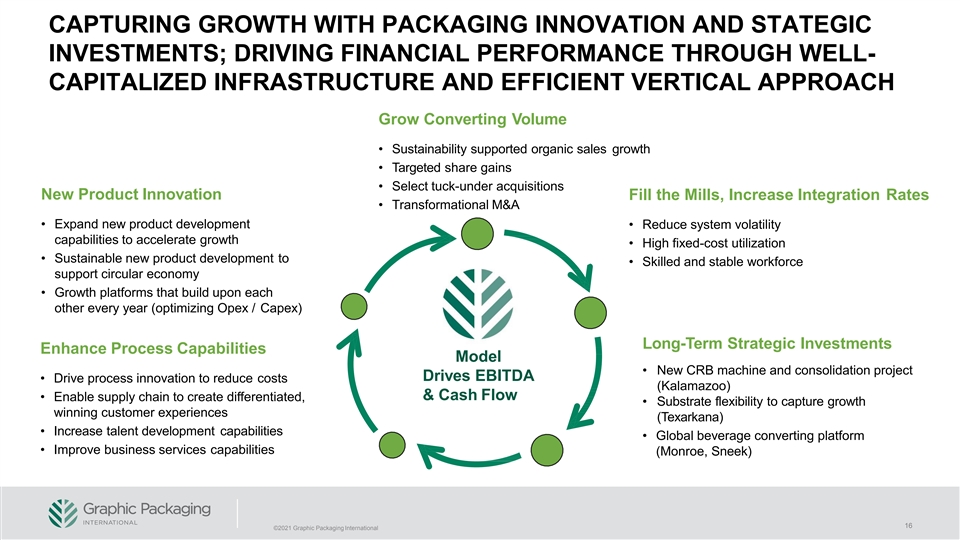
CAPTURING GROWTH WITH PACKAGING INNOVATION AND STATEGIC INVESTMENTS; DRIVING FINANCIAL PERFORMANCE THROUGH WELL- CAPITALIZED INFRASTRUCTURE AND EFFICIENT VERTICAL APPROACH Grow Converting Volume • Sustainability supported organic sales growth • Targeted share gains • Select tuck-under acquisitions New Product Innovation Fill the Mills, Increase Integration Rates • Transformational M&A • Expand new product development • Reduce system volatility capabilities to accelerate growth • High fixed-cost utilization • Sustainable new product development to • Skilled and stable workforce support circular economy • Growth platforms that build upon each other every year (optimizing Opex / Capex) Long-Term Strategic Investments Enhance Process Capabilities Model • New CRB machine and consolidation project Drives EBITDA • Drive process innovation to reduce costs (Kalamazoo) & Cash Flow • Enable supply chain to create differentiated, • Substrate flexibility to capture growth winning customer experiences (Texarkana) • Increase talent development capabilities • Global beverage converting platform • Improve business services capabilities (Monroe, Sneek) 16 ©2021 Graphic Packaging International
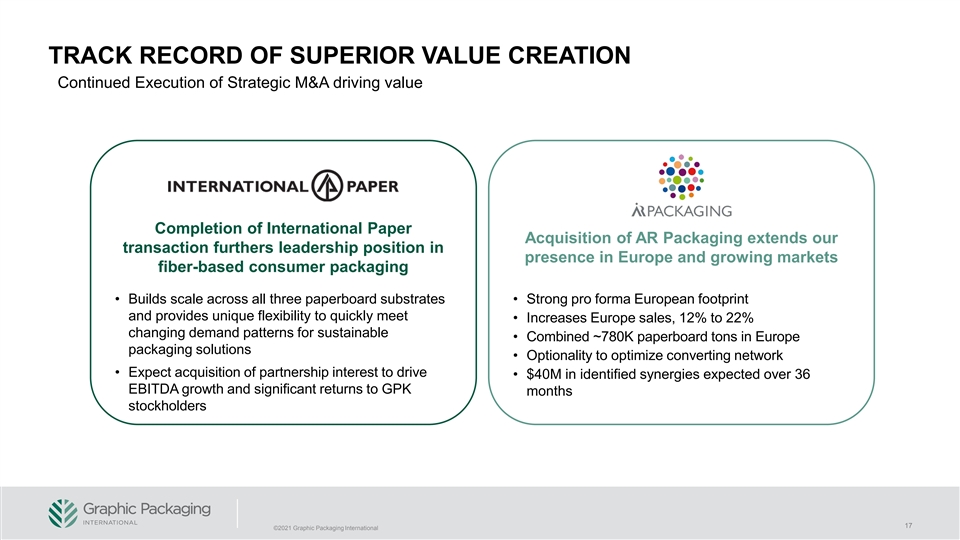
TRACK RECORD OF SUPERIOR VALUE CREATION Continued Execution of Strategic M&A driving value Completion of International Paper Acquisition of AR Packaging extends our transaction furthers leadership position in presence in Europe and growing markets fiber-based consumer packaging • Builds scale across all three paperboard substrates • Strong pro forma European footprint and provides unique flexibility to quickly meet • Increases Europe sales, 12% to 22% changing demand patterns for sustainable • Combined ~780K paperboard tons in Europe packaging solutions • Optionality to optimize converting network • Expect acquisition of partnership interest to drive • $40M in identified synergies expected over 36 EBITDA growth and significant returns to GPK months stockholders 17 ©2021 Graphic Packaging International
AGENDA Graphic Packaging Today Our Role in Driving a More Sustainable Future Positioned to Deliver Stakeholder Value ESG Leadership Core to Business Engaged Board with Strong Governance Practices 18 ©2021 Graphic Packaging International
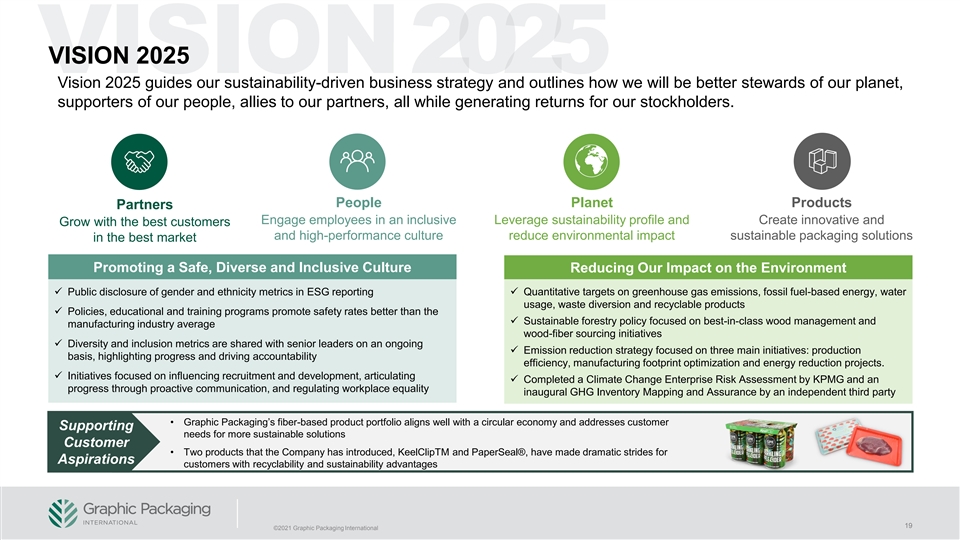
VISION 2025 Vision 2025 guides our sustainability-driven business strategy and outlines how we will be better stewards of our planet, supporters of our people, allies to our partners, all while generating returns for our stockholders. People Planet Products Partners Engage employees in an inclusive Leverage sustainability profile and Create innovative and Grow with the best customers and high-performance culture reduce environmental impact sustainable packaging solutions in the best market Promoting a Safe, Diverse and Inclusive Culture Reducing Our Impact on the Environment ✓ Public disclosure of gender and ethnicity metrics in ESG reporting✓ Quantitative targets on greenhouse gas emissions, fossil fuel-based energy, water usage, waste diversion and recyclable products ✓ Policies, educational and training programs promote safety rates better than the ✓ Sustainable forestry policy focused on best-in-class wood management and manufacturing industry average wood-fiber sourcing initiatives ✓ Diversity and inclusion metrics are shared with senior leaders on an ongoing ✓ Emission reduction strategy focused on three main initiatives: production basis, highlighting progress and driving accountability efficiency, manufacturing footprint optimization and energy reduction projects. ✓ Initiatives focused on influencing recruitment and development, articulating ✓ Completed a Climate Change Enterprise Risk Assessment by KPMG and an progress through proactive communication, and regulating workplace equality inaugural GHG Inventory Mapping and Assurance by an independent third party • Graphic Packaging’s fiber-based product portfolio aligns well with a circular economy and addresses customer Supporting needs for more sustainable solutions Customer • Two products that the Company has introduced, KeelClipTM and PaperSeal®, have made dramatic strides for Aspirations customers with recyclability and sustainability advantages 19 ©2021 Graphic Packaging International
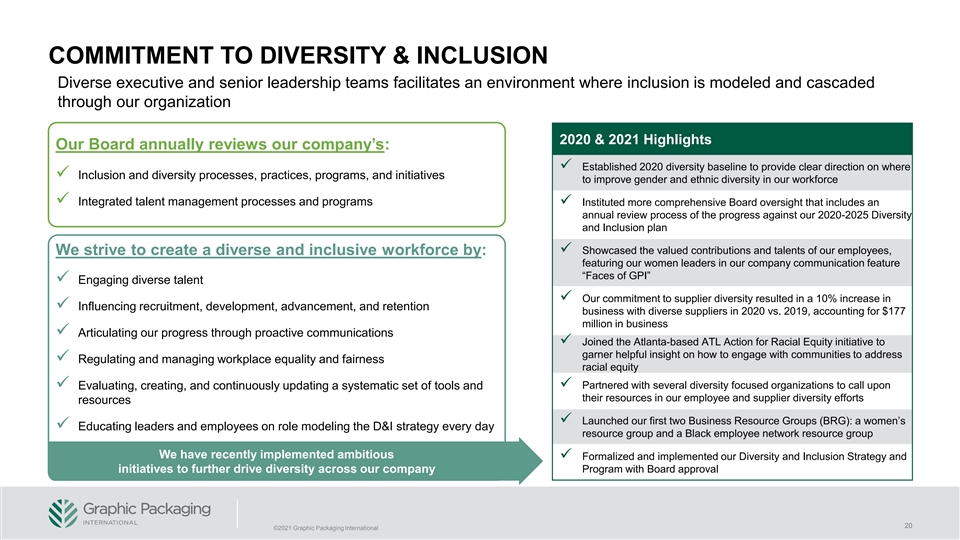
COMMITMENT TO DIVERSITY & INCLUSION Diverse executive and senior leadership teams facilitates an environment where inclusion is modeled and cascaded through our organization 2020 & 2021 Highlights Our Board annually reviews our company’s: ✓ Established 2020 diversity baseline to provide clear direction on where ✓ Inclusion and diversity processes, practices, programs, and initiatives to improve gender and ethnic diversity in our workforce ✓ Integrated talent management processes and programs✓ Instituted more comprehensive Board oversight that includes an annual review process of the progress against our 2020-2025 Diversity and Inclusion plan ✓ Showcased the valued contributions and talents of our employees, We strive to create a diverse and inclusive workforce by: featuring our women leaders in our company communication feature “Faces of GPI” ✓ Engaging diverse talent ✓ Our commitment to supplier diversity resulted in a 10% increase in ✓ Influencing recruitment, development, advancement, and retention business with diverse suppliers in 2020 vs. 2019, accounting for $177 million in business ✓ Articulating our progress through proactive communications ✓ Joined the Atlanta-based ATL Action for Racial Equity initiative to garner helpful insight on how to engage with communities to address ✓ Regulating and managing workplace equality and fairness racial equity ✓ Partnered with several diversity focused organizations to call upon ✓ Evaluating, creating, and continuously updating a systematic set of tools and their resources in our employee and supplier diversity efforts resources ✓ Launched our first two Business Resource Groups (BRG): a women’s ✓ Educating leaders and employees on role modeling the D&I strategy every day resource group and a Black employee network resource group We have recently implemented ambitious ✓ Formalized and implemented our Diversity and Inclusion Strategy and initiatives to further drive diversity across our company Program with Board approval 20 ©2021 Graphic Packaging International
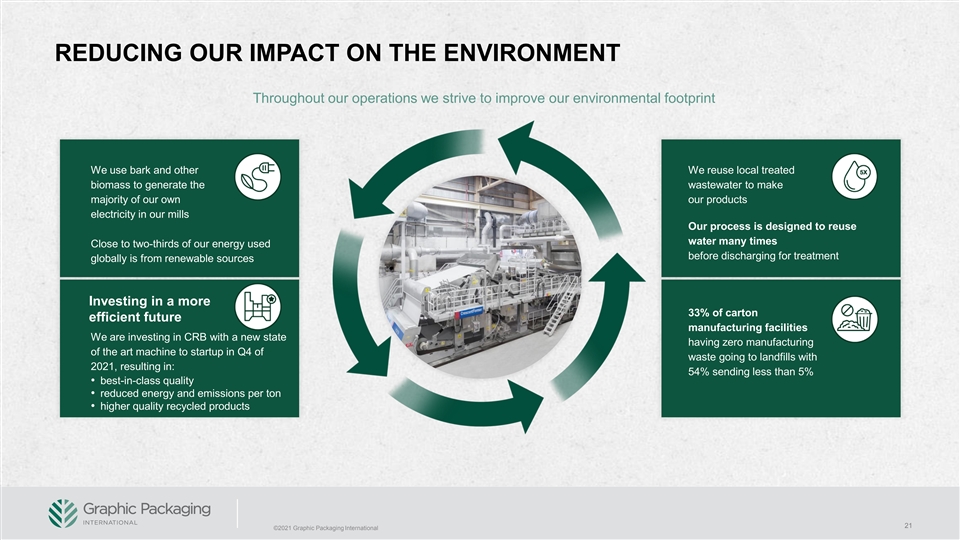
REDUCING OUR IMPACT ON THE ENVIRONMENT Throughout our operations we strive to improve our environmental footprint We use bark and other We reuse local treated biomass to generate the wastewater to make majority of our own our products electricity in our mills Our process is designed to reuse water many times Close to two-thirds of our energy used before discharging for treatment globally is from renewable sources Investing in a more 33% of carton efficient future manufacturing facilities We are investing in CRB with a new state having zero manufacturing of the art machine to startup in Q4 of waste going to landfills with 2021, resulting in: 54% sending less than 5% • best-in-class quality • reduced energy and emissions per ton • higher quality recycled products 21 ©2021 Graphic Packaging International
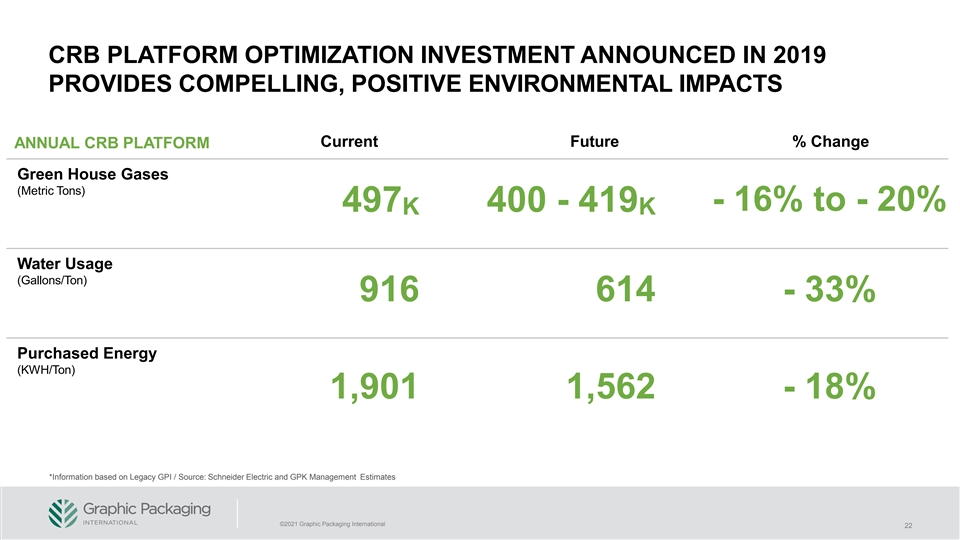
CRB PLATFORM OPTIMIZATION INVESTMENT ANNOUNCED IN 2019 PROVIDES COMPELLING, POSITIVE ENVIRONMENTAL IMPACTS Current Future % Change ANNUAL CRB PLATFORM Green House Gases (Metric Tons) - 16% to - 20% 497 400 - 419 K K Water Usage (Gallons/Ton) 916 614 - 33% Purchased Energy (KWH/Ton) 1,901 1,562 - 18% *Information based on Legacy GPI / Source: Schneider Electric and GPK Management Estimates ©2021 Graphic Packaging International 22
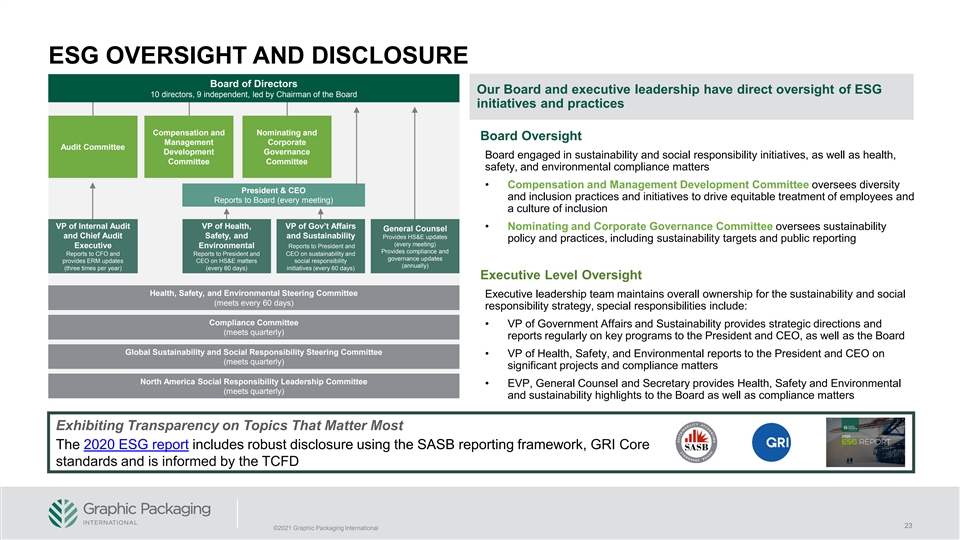
ESG OVERSIGHT AND DISCLOSURE Board of Directors Our Board and executive leadership have direct oversight of ESG 10 directors, 9 independent, led by Chairman of the Board initiatives and practices Compensation and Nominating and Board Oversight Management Corporate Audit Committee Development Governance Board engaged in sustainability and social responsibility initiatives, as well as health, Committee Committee safety, and environmental compliance matters • Compensation and Management Development Committee oversees diversity President & CEO and inclusion practices and initiatives to drive equitable treatment of employees and Reports to Board (every meeting) a culture of inclusion VP of Internal Audit VP of Health, VP of Gov’t Affairs • Nominating and Corporate Governance Committee oversees sustainability General Counsel and Chief Audit Safety, and and Sustainability Provides HS&E updates policy and practices, including sustainability targets and public reporting (every meeting) Executive Environmental Reports to President and Provides compliance and Reports to CFO and Reports to President and CEO on sustainability and governance updates provides ERM updates CEO on HS&E matters social responsibility (annually) (three times per year) (every 60 days) initiatives (every 60 days) Executive Level Oversight Health, Safety, and Environmental Steering Committee Executive leadership team maintains overall ownership for the sustainability and social (meets every 60 days) responsibility strategy, special responsibilities include: Compliance Committee • VP of Government Affairs and Sustainability provides strategic directions and (meets quarterly) reports regularly on key programs to the President and CEO, as well as the Board Global Sustainability and Social Responsibility Steering Committee • VP of Health, Safety, and Environmental reports to the President and CEO on (meets quarterly) significant projects and compliance matters North America Social Responsibility Leadership Committee • EVP, General Counsel and Secretary provides Health, Safety and Environmental (meets quarterly) and sustainability highlights to the Board as well as compliance matters Exhibiting Transparency on Topics That Matter Most The 2020 ESG report includes robust disclosure using the SASB reporting framework, GRI Core standards and is informed by the TCFD 23 ©2021 Graphic Packaging International
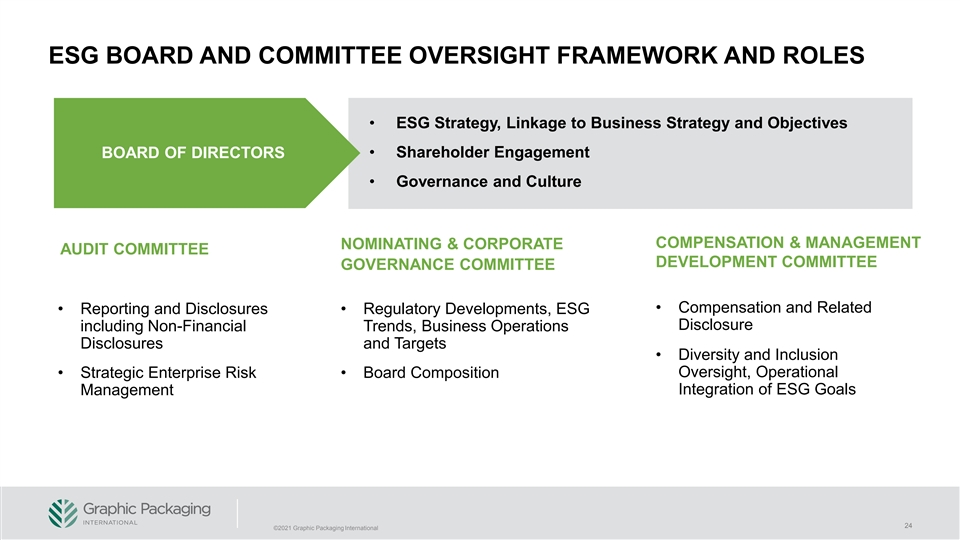
ESG BOARD AND COMMITTEE OVERSIGHT FRAMEWORK AND ROLES • ESG Strategy, Linkage to Business Strategy and Objectives BOARD OF DIRECTORS • Shareholder Engagement • Governance and Culture COMPENSATION & MANAGEMENT NOMINATING & CORPORATE AUDIT COMMITTEE DEVELOPMENT COMMITTEE GOVERNANCE COMMITTEE • Compensation and Related • Reporting and Disclosures • Regulatory Developments, ESG Disclosure including Non-Financial Trends, Business Operations Disclosures and Targets • Diversity and Inclusion Oversight, Operational • Strategic Enterprise Risk • Board Composition Management Integration of ESG Goals 24 ©2021 Graphic Packaging International
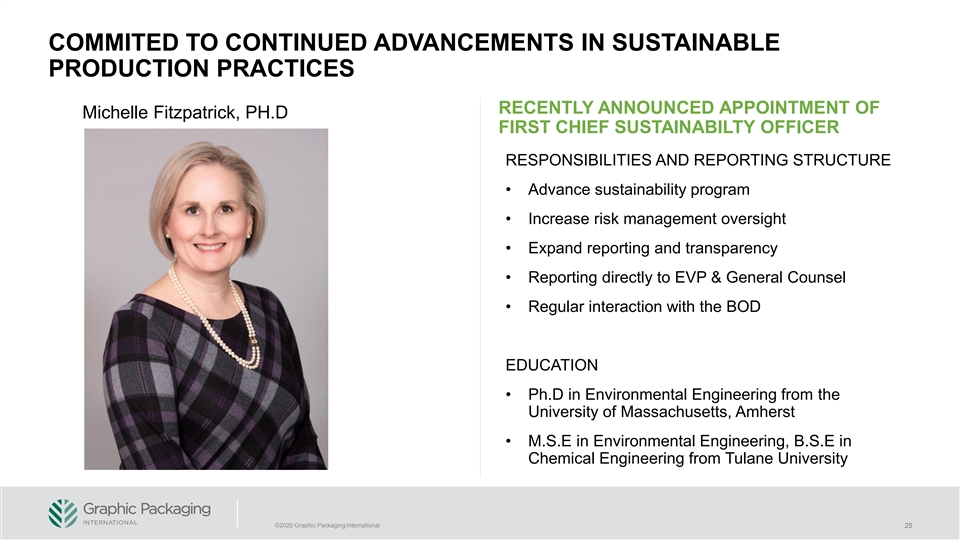
COMMITED TO CONTINUED ADVANCEMENTS IN SUSTAINABLE PRODUCTION PRACTICES RECENTLY ANNOUNCED APPOINTMENT OF Michelle Fitzpatrick, PH.D FIRST CHIEF SUSTAINABILTY OFFICER RESPONSIBILITIES AND REPORTING STRUCTURE • Advance sustainability program • Increase risk management oversight • Expand reporting and transparency • Reporting directly to EVP & General Counsel • Regular interaction with the BOD EDUCATION • Ph.D in Environmental Engineering from the University of Massachusetts, Amherst • M.S.E in Environmental Engineering, B.S.E in Chemical Engineering from Tulane University ©2020 Graphic Packaging International 25
AGENDA Graphic Packaging Today Our Role in Driving a More Sustainable Future Positioned to Deliver Stakeholder Value ESG Leadership Core to Business Engaged Board with Strong Governance Practices 26 ©2021 Graphic Packaging International
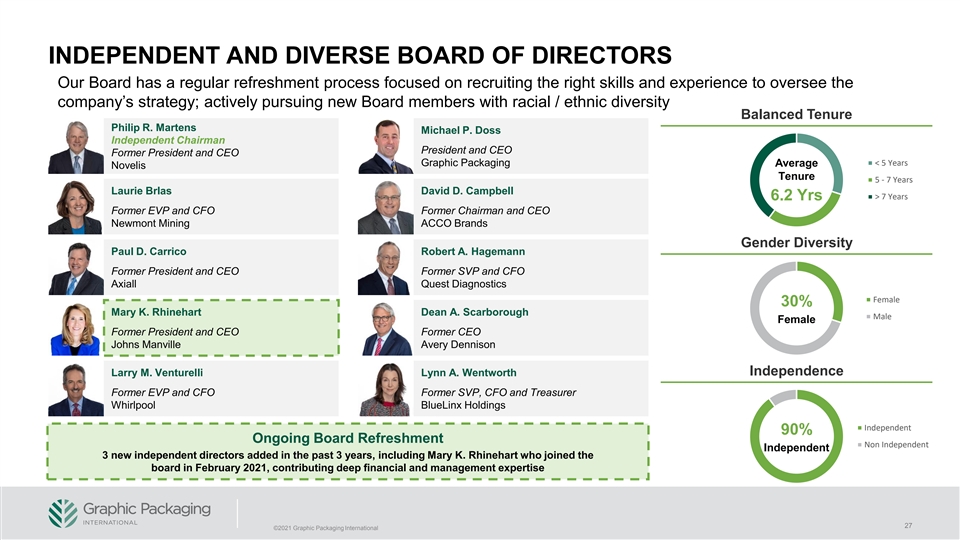
INDEPENDENT AND DIVERSE BOARD OF DIRECTORS Our Board has a regular refreshment process focused on recruiting the right skills and experience to oversee the company’s strategy; actively pursuing new Board members with racial / ethnic diversity Balanced Tenure Philip R. Martens Michael P. Doss Independent Chairman President and CEO Former President and CEO Graphic Packaging < 5 Years Average Novelis Tenure 5 - 7 Years Laurie Brlas David D. Campbell > 7 Years 6.2 Yrs Former EVP and CFO Former Chairman and CEO Newmont Mining ACCO Brands Gender Diversity Paul D. Carrico Robert A. Hagemann Former President and CEO Former SVP and CFO Axiall Quest Diagnostics Female 30% Mary K. Rhinehart Dean A. Scarborough Male Female Former President and CEO Former CEO Johns Manville Avery Dennison Larry M. Venturelli Lynn A. Wentworth Independence Former EVP and CFO Former SVP, CFO and Treasurer Whirlpool BlueLinx Holdings Independent 90% Ongoing Board Refreshment Non Independent Independent 3 new independent directors added in the past 3 years, including Mary K. Rhinehart who joined the board in February 2021, contributing deep financial and management expertise 27 ©2021 Graphic Packaging International
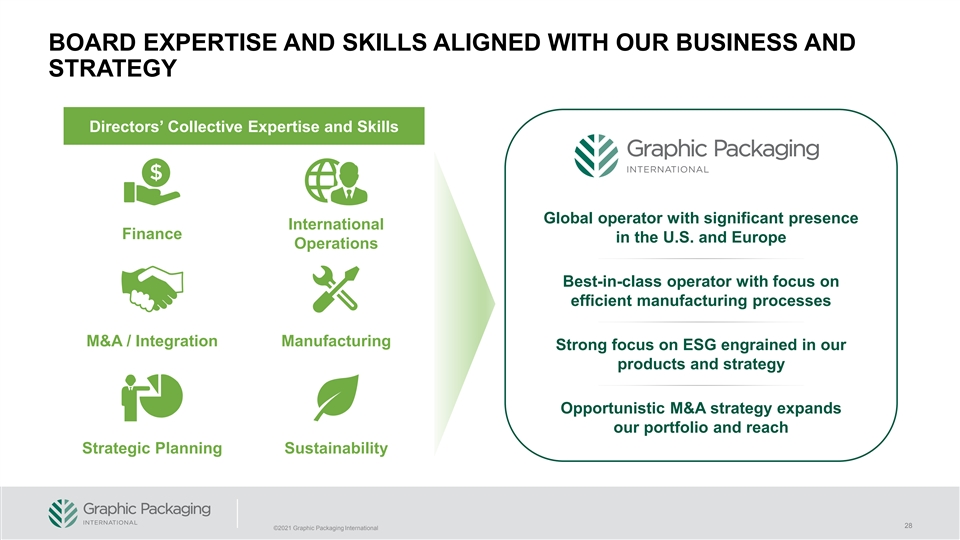
BOARD EXPERTISE AND SKILLS ALIGNED WITH OUR BUSINESS AND STRATEGY Directors’ Collective Expertise and Skills Global operator with significant presence International Finance in the U.S. and Europe Operations Best-in-class operator with focus on efficient manufacturing processes M&A / Integration Manufacturing Strong focus on ESG engrained in our products and strategy Opportunistic M&A strategy expands our portfolio and reach Strategic Planning Sustainability 28 ©2021 Graphic Packaging International
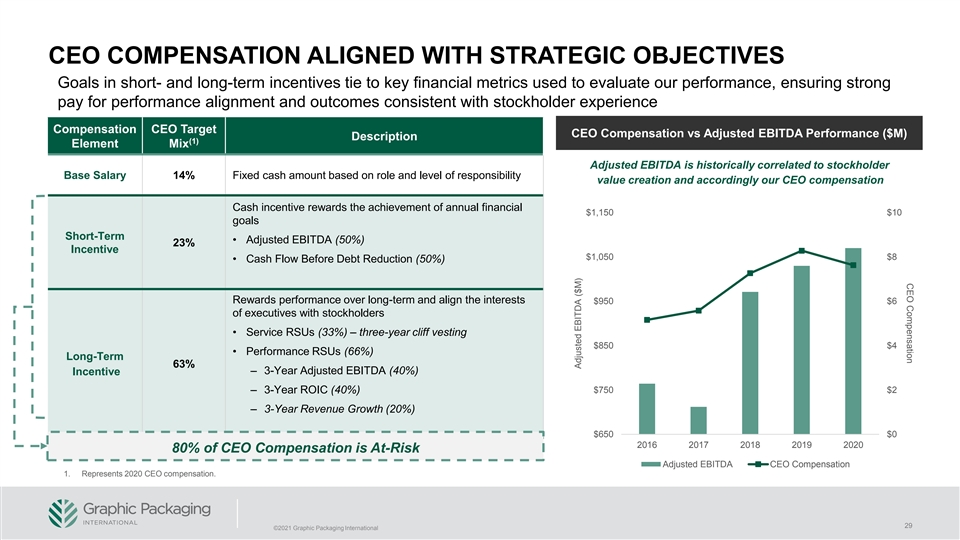
CEO Compensation CEO COMPENSATION ALIGNED WITH STRATEGIC OBJECTIVES Goals in short- and long-term incentives tie to key financial metrics used to evaluate our performance, ensuring strong pay for performance alignment and outcomes consistent with stockholder experience Compensation CEO Target CEO Compensation vs Adjusted EBITDA Performance ($M) Description (1) Element Mix Adjusted EBITDA is historically correlated to stockholder Base Salary 14% Fixed cash amount based on role and level of responsibility value creation and accordingly our CEO compensation Cash incentive rewards the achievement of annual financial $1,150 $10 goals Short-Term • Adjusted EBITDA (50%) 23% Incentive $1,050 $8 • Cash Flow Before Debt Reduction (50%) Rewards performance over long-term and align the interests $950 $6 of executives with stockholders • Service RSUs (33%) – three-year cliff vesting $850 $4 • Performance RSUs (66%) Long-Term 63% – 3-Year Adjusted EBITDA (40%) Incentive $750 $2 – 3-Year ROIC (40%) – 3-Year Revenue Growth (20%) $650 $0 2016 2017 2018 2019 2020 80% of CEO Compensation is At-Risk Adjusted EBITDA CEO Compensation 1. Represents 2020 CEO compensation. 29 ©2021 Graphic Packaging International Adjusted EBITDA ($M)
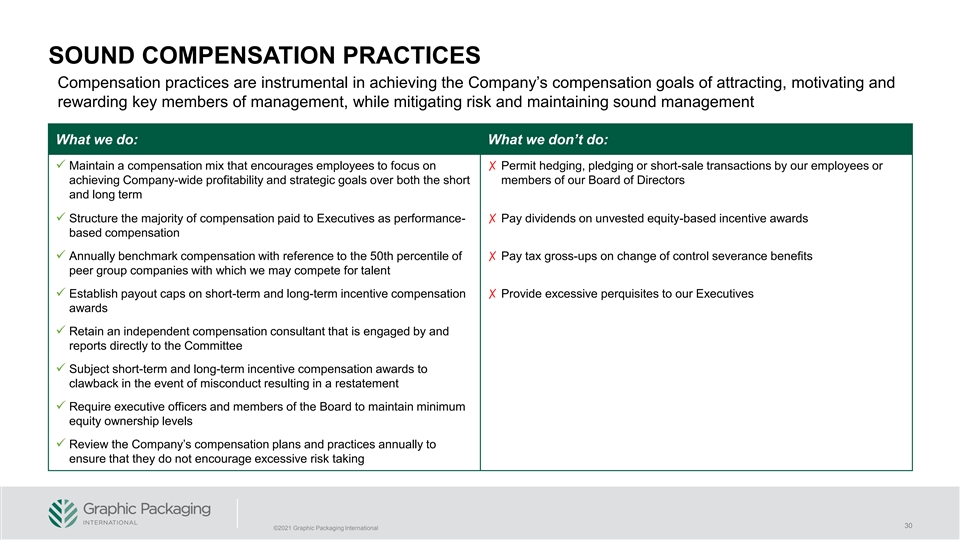
SOUND COMPENSATION PRACTICES Compensation practices are instrumental in achieving the Company’s compensation goals of attracting, motivating and rewarding key members of management, while mitigating risk and maintaining sound management What we do: What we don’t do: ✓ Maintain a compensation mix that encourages employees to focus on ✗ Permit hedging, pledging or short-sale transactions by our employees or achieving Company-wide profitability and strategic goals over both the short members of our Board of Directors and long term ✓ Structure the majority of compensation paid to Executives as performance-✗ Pay dividends on unvested equity-based incentive awards based compensation ✓ Annually benchmark compensation with reference to the 50th percentile of ✗ Pay tax gross-ups on change of control severance benefits peer group companies with which we may compete for talent ✓ Establish payout caps on short-term and long-term incentive compensation ✗ Provide excessive perquisites to our Executives awards ✓ Retain an independent compensation consultant that is engaged by and reports directly to the Committee ✓ Subject short-term and long-term incentive compensation awards to clawback in the event of misconduct resulting in a restatement ✓ Require executive officers and members of the Board to maintain minimum equity ownership levels ✓ Review the Company’s compensation plans and practices annually to ensure that they do not encourage excessive risk taking 30 ©2021 Graphic Packaging International