EX-99.1
Published on November 27, 2023
Exhibit 99.1 Investor Engagement November 2023
FORWARD LOOKING STATEMENTS CAUTIONARY STATEMENT REGARDING FORWARD-LOOKING STATEMENTS • Any statements of the Company’s expectations in these slides, including, but not limited to, guidance regarding 2023 Sales, progress with respect to Vision 2025 goals and alignment of such goals with the United Nations Sustainable Development Goals constitute “forward-looking statements” as defined in the Private Securities Litigation Reform Act of 1995. Such statements are based on currently available operating, financial and competitive information and are subject to various risks and uncertainties that could cause actual results to differ materially from the Company’s historical experience and its present expectations. These risks and uncertainties include, but are not limited to, inflation of and volatility in raw material and energy costs, changes in consumer buying habits and product preferences, competition with other paperboard manufacturers and product substitution, the Company’s ability to implement its business strategies, including strategic acquisitions, productivity initiatives, cost reduction plans and integration activities, as well as the Company’s debt level, currency movements and other risks of conducting business internationally, the impact of regulatory and litigation matters, including the continued availability of the Company's U.S. federal income tax attributes to offset U.S. federal income taxes and the timing related to the Company’s future U.S. federal income tax payments. Undue reliance should not be placed on such forward-looking statements, as such statements speak only as of the date on which they are made and the Company undertakes no obligation to update such statements, except as may be required by law. Additional information regarding these and other risks is contained in the Company’s periodic filings with the Securities and Exchange Commission. NON-GAAP FINANCIAL MEASURES & RECONCILIATIONS • This presentation may include certain historic financial measures that exclude or adjust for charges or income associated with business combinations, facility shutdowns, extended mill outages, sales of assets and other special charges or income (“Non-GAAP Financial Measures”). The Company’s management believes that the presentation of these Non-GAAP Financial Measures provides useful information to investors because these measures are regularly used by management in assessing the Company’s performance. These Non-GAAP Financial Measures are not calculated in accordance with generally accepted accounting principles in the United States (“GAAP”) and should be considered in addition to results prepared in accordance with GAAP, but should not be considered substitutes for or superior to GAAP results. In addition, these Non-GAAP Financial Measures may not be comparable to similarly-titled measures utilized by other companies, since such other companies may not calculate such measures in the same manner as we do. A reconciliation of Non-GAAP Financial Measures used by the Company to the most relevant GAAP measures are provided in the Appendix to the Company’s latest quarterly earnings press release. Note that a reconciliation of Non-GAAP Financial Measures provided as future performance guidance to the most relevant GAAP measure is not provided, as the Company is unable to reasonably estimate the timing or financial impact of items such as charges associated with business combinations and other special charges. The inability to estimate these future items makes a detailed reconciliation of these forward-looking non-GAAP financial measures impracticable. 2

OUR PURPOSE We package life’s everyday moments for a renewable future 3

COMPANY OVERVIEW
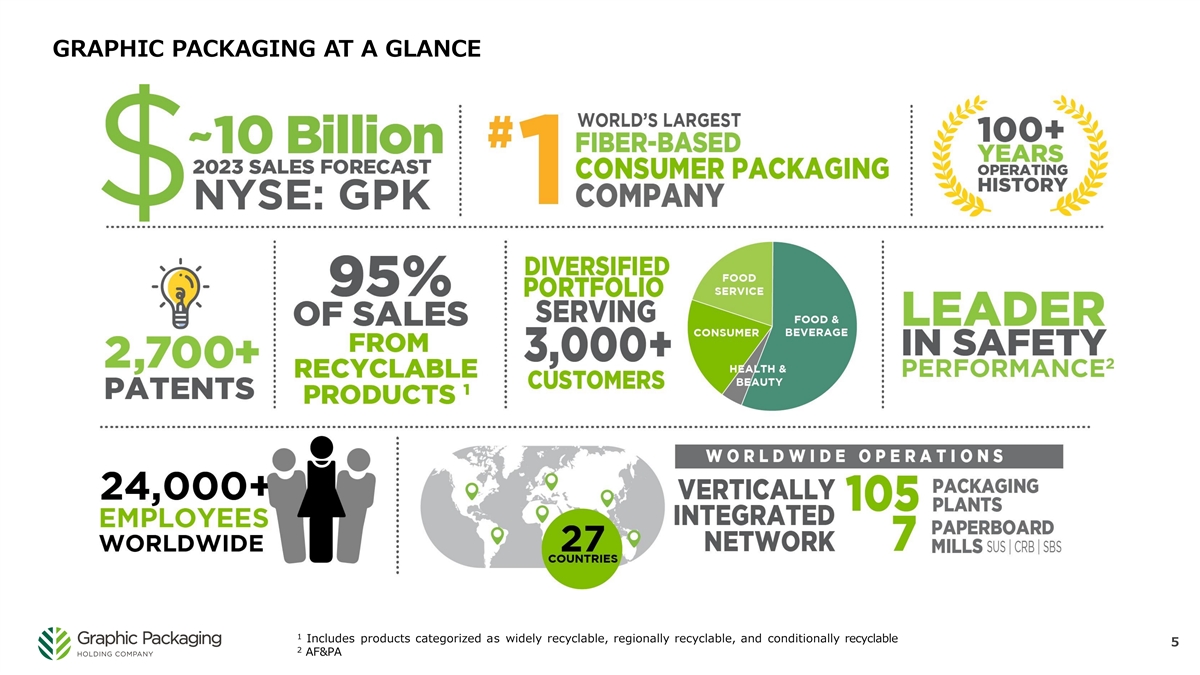
GRAPHIC PACKAGING AT A GLANCE 1 Includes products categorized as widely recyclable, regionally recyclable, and conditionally recyclable 5 2 AF&PA
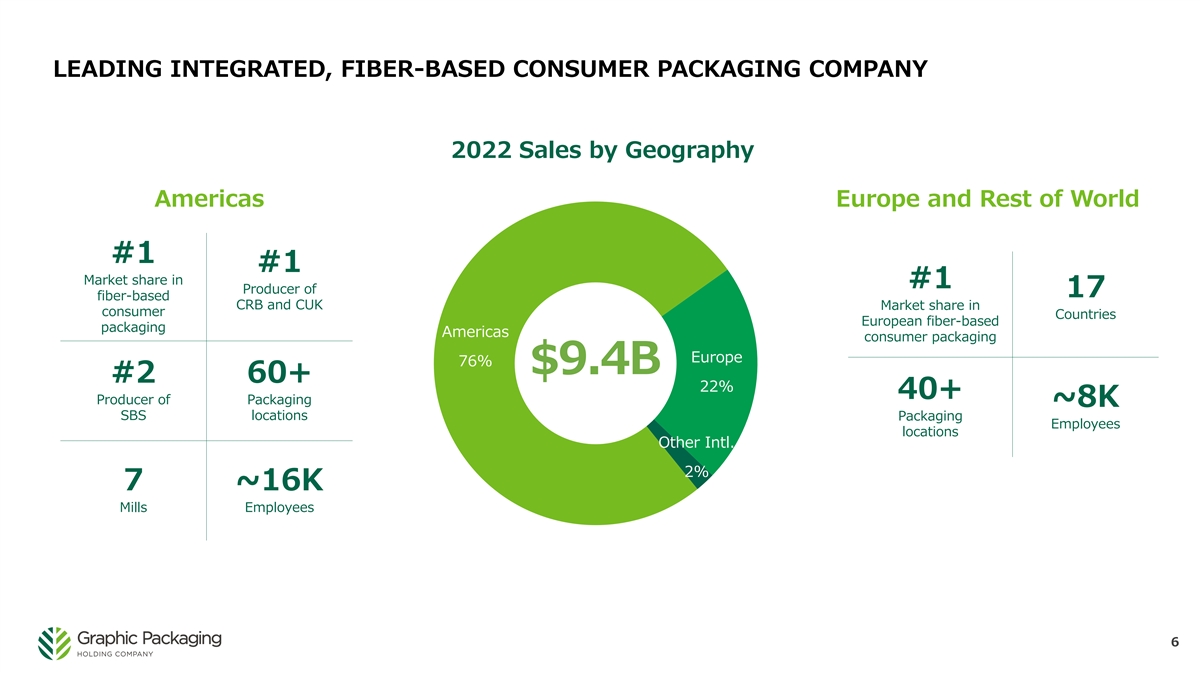
LEADING INTEGRATED, FIBER-BASED CONSUMER PACKAGING COMPANY 2022 Sales by Geography Americas Europe and Rest of World #1 #1 Market share in #1 Producer of 17 fiber-based CRB and CUK Market share in consumer Countries European fiber-based packaging Americas consumer packaging Europe 76% $9.4B #2 60+ 22% 40+ Producer of Packaging ~8K SBS locations Packaging Employees locations Other Intl. 2% 7 ~16K Mills Employees 6
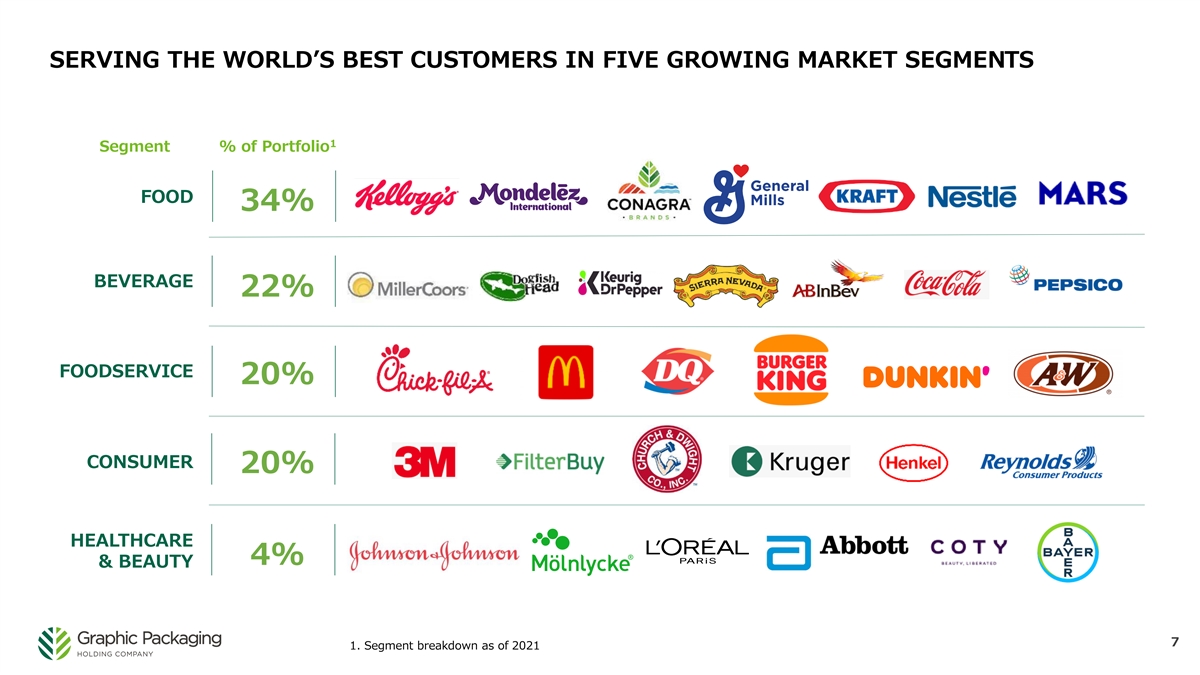
SERVING THE WORLD’S BEST CUSTOMERS IN FIVE GROWING MARKET SEGMENTS 1 Segment % of Portfolio FOOD 34% BEVERAGE 22% FOODSERVICE 20% CONSUMER 20% HEALTHCARE 4% & BEAUTY 7 1. Segment breakdown as of 2021
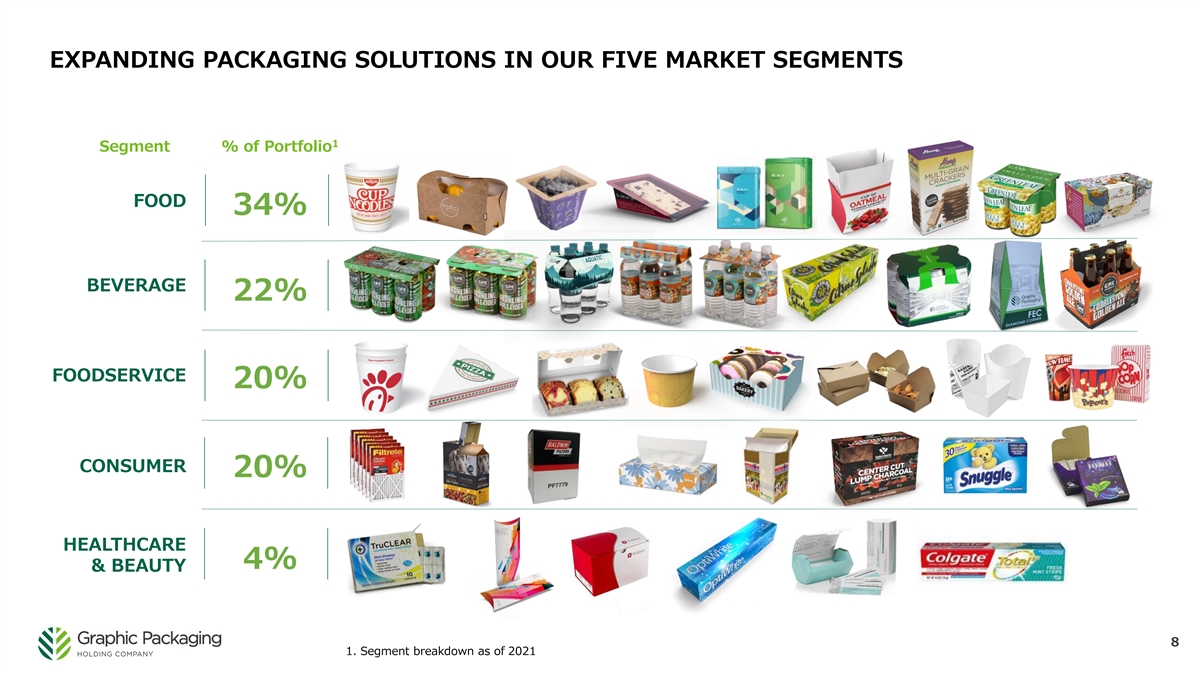
EXPANDING PACKAGING SOLUTIONS IN OUR FIVE MARKET SEGMENTS 1 Segment % of Portfolio FOOD 34% BEVERAGE 22% FOODSERVICE 20% CONSUMER 20% HEALTHCARE 4% & BEAUTY 8 1. Segment breakdown as of 2021
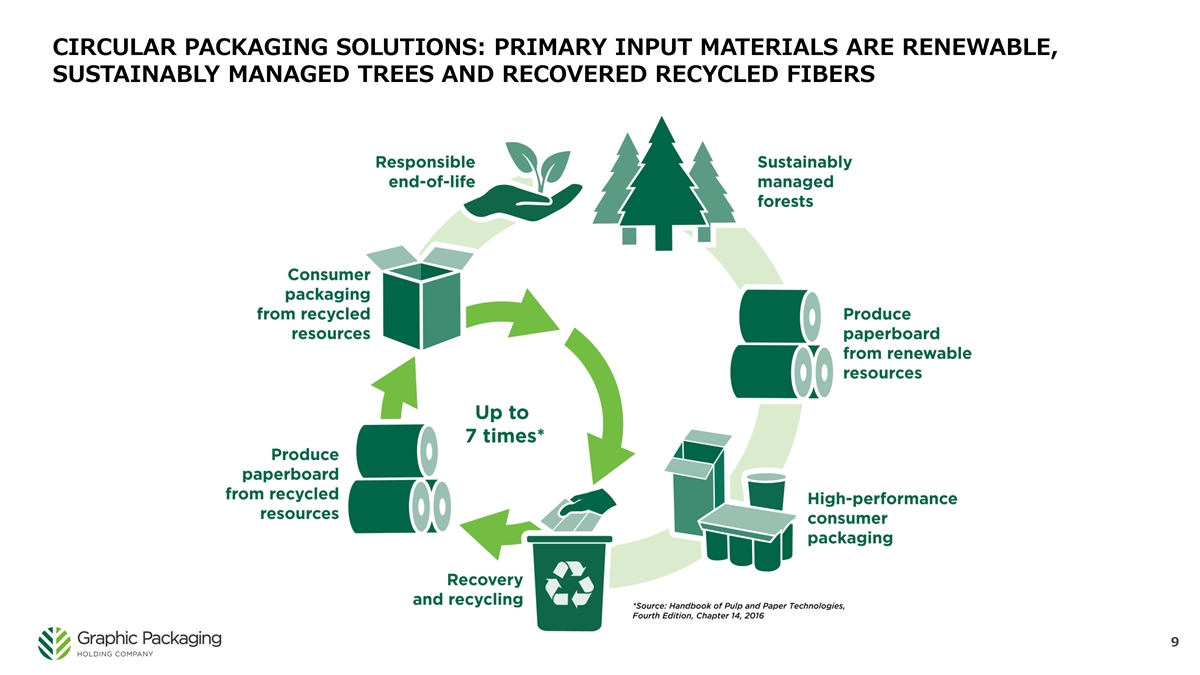
CIRCULAR PACKAGING SOLUTIONS: PRIMARY INPUT MATERIALS ARE RENEWABLE, SUSTAINABLY MANAGED TREES AND RECOVERED RECYCLED FIBERS 9
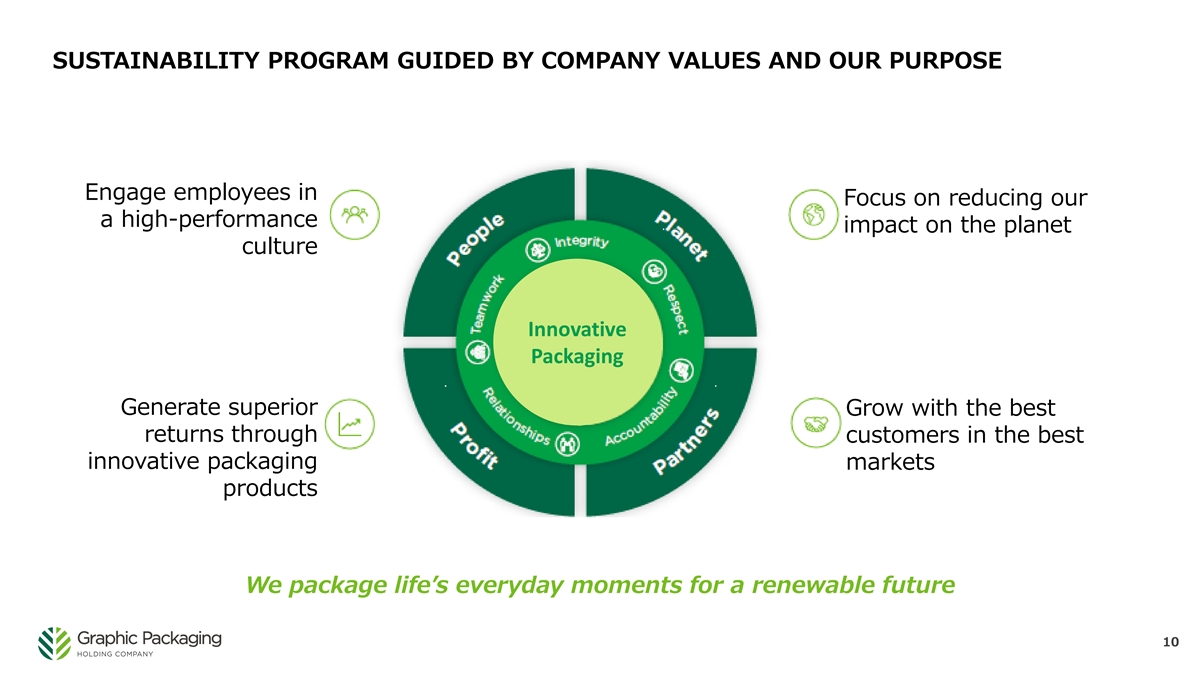
SUSTAINABILITY PROGRAM GUIDED BY COMPANY VALUES AND OUR PURPOSE Engage employees in Focus on reducing our a high-performance impact on the planet culture Innovative Packaging Generate superior Grow with the best returns through customers in the best innovative packaging markets products We package life’s everyday moments for a renewable future 10
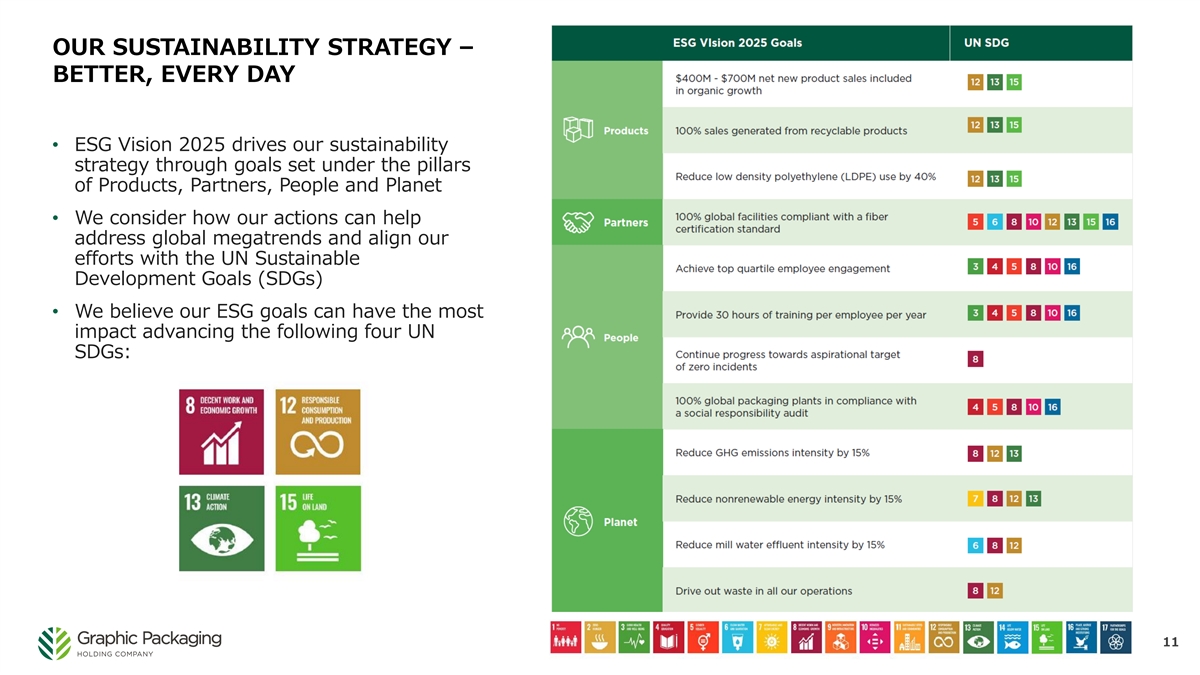
OUR SUSTAINABILITY STRATEGY – BETTER, EVERY DAY • ESG Vision 2025 drives our sustainability strategy through goals set under the pillars of Products, Partners, People and Planet • We consider how our actions can help address global megatrends and align our efforts with the UN Sustainable Development Goals (SDGs) • We believe our ESG goals can have the most impact advancing the following four UN SDGs: 11
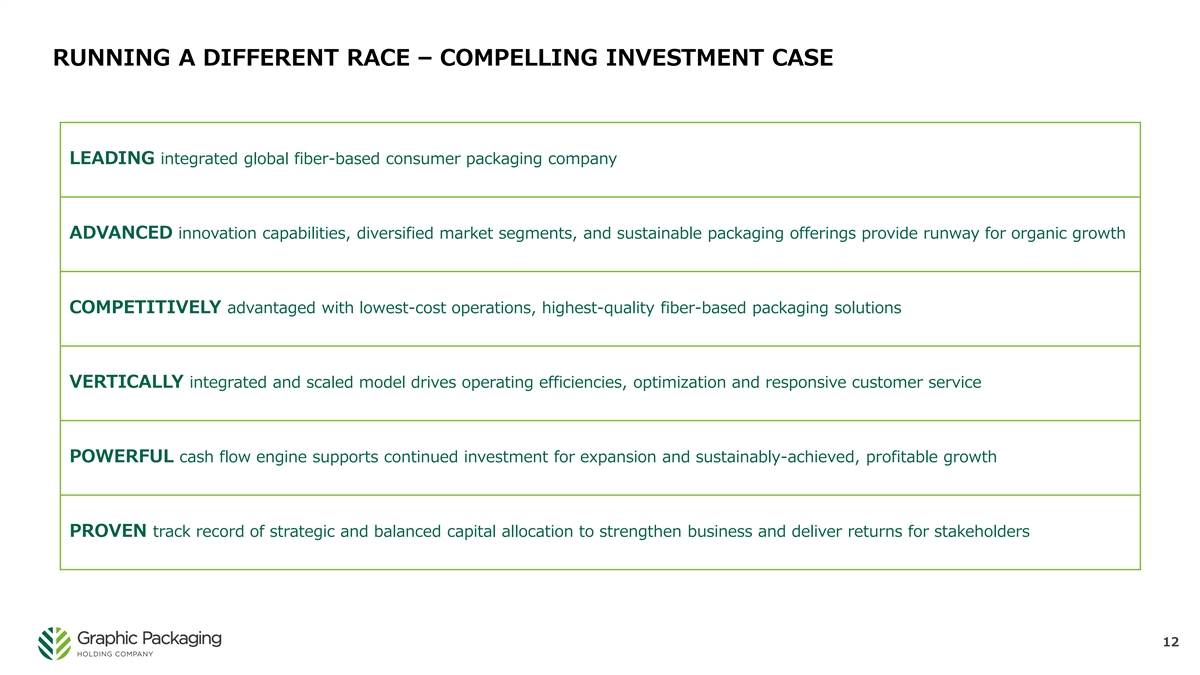
RUNNING A DIFFERENT RACE – COMPELLING INVESTMENT CASE LEADING integrated global fiber-based consumer packaging company ADVANCED innovation capabilities, diversified market segments, and sustainable packaging offerings provide runway for organic growth COMPETITIVELY advantaged with lowest-cost operations, highest-quality fiber-based packaging solutions VERTICALLY integrated and scaled model drives operating efficiencies, optimization and responsive customer service POWERFUL cash flow engine supports continued investment for expansion and sustainably-achieved, profitable growth PROVEN track record of strategic and balanced capital allocation to strengthen business and deliver returns for stakeholders 12
SOCIAL & ENVIRONMENTAL
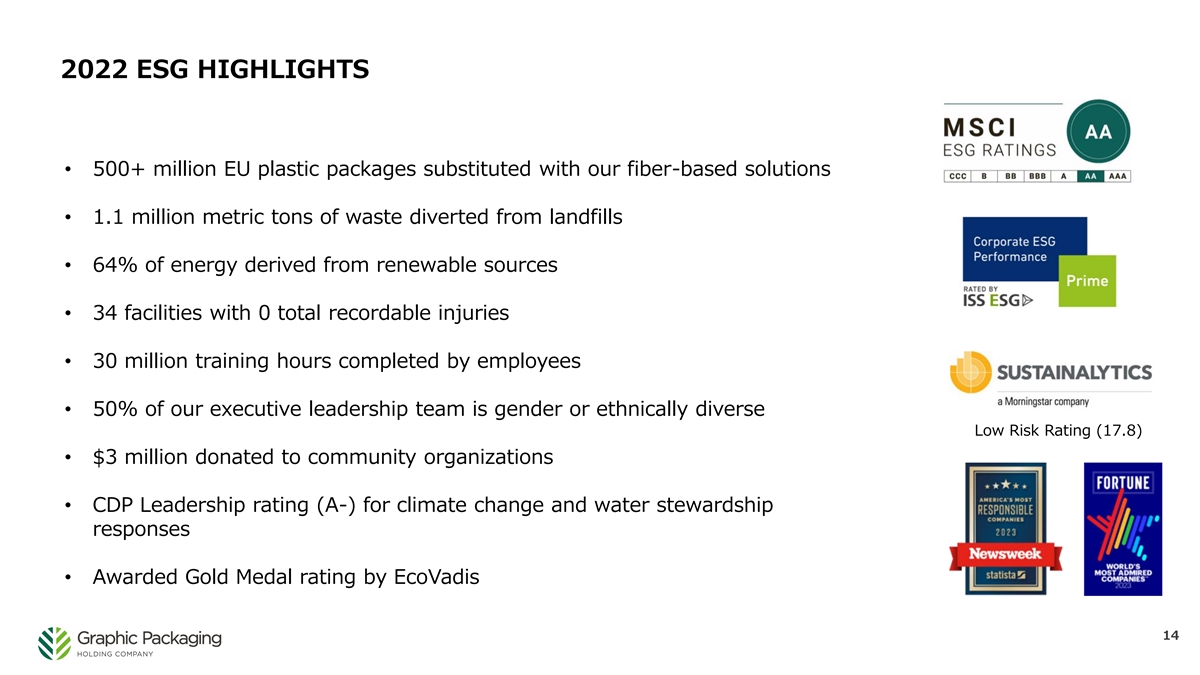
2022 ESG HIGHLIGHTS • 500+ million EU plastic packages substituted with our fiber-based solutions • 1.1 million metric tons of waste diverted from landfills • 64% of energy derived from renewable sources • 34 facilities with 0 total recordable injuries • 30 million training hours completed by employees • 50% of our executive leadership team is gender or ethnically diverse Low Risk Rating (17.8) • $3 million donated to community organizations • CDP Leadership rating (A-) for climate change and water stewardship responses • Awarded Gold Medal rating by EcoVadis 14
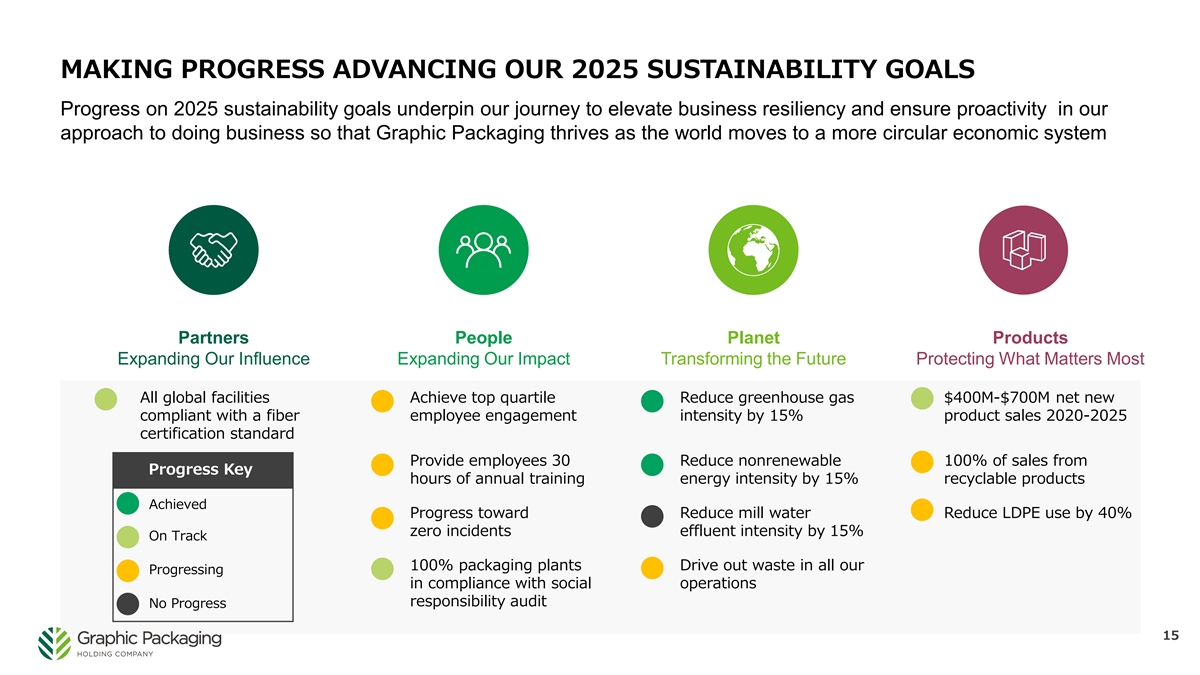
MAKING PROGRESS ADVANCING OUR 2025 SUSTAINABILITY GOALS Progress on 2025 sustainability goals underpin our journey to elevate business resiliency and ensure proactivity in our approach to doing business so that Graphic Packaging thrives as the world moves to a more circular economic system Partners People Planet Products Expanding Our Influence Expanding Our Impact Transforming the Future Protecting What Matters Most All global facilities Achieve top quartile Reduce greenhouse gas $400M-$700M net new compliant with a fiber employee engagement intensity by 15% product sales 2020-2025 certification standard Provide employees 30 Reduce nonrenewable 100% of sales from Progress Key hours of annual training energy intensity by 15% recyclable products Achieved Progress toward Reduce mill water Reduce LDPE use by 40% zero incidents effluent intensity by 15% On Track 100% packaging plants Drive out waste in all our Progressing in compliance with social operations responsibility audit No Progress 15
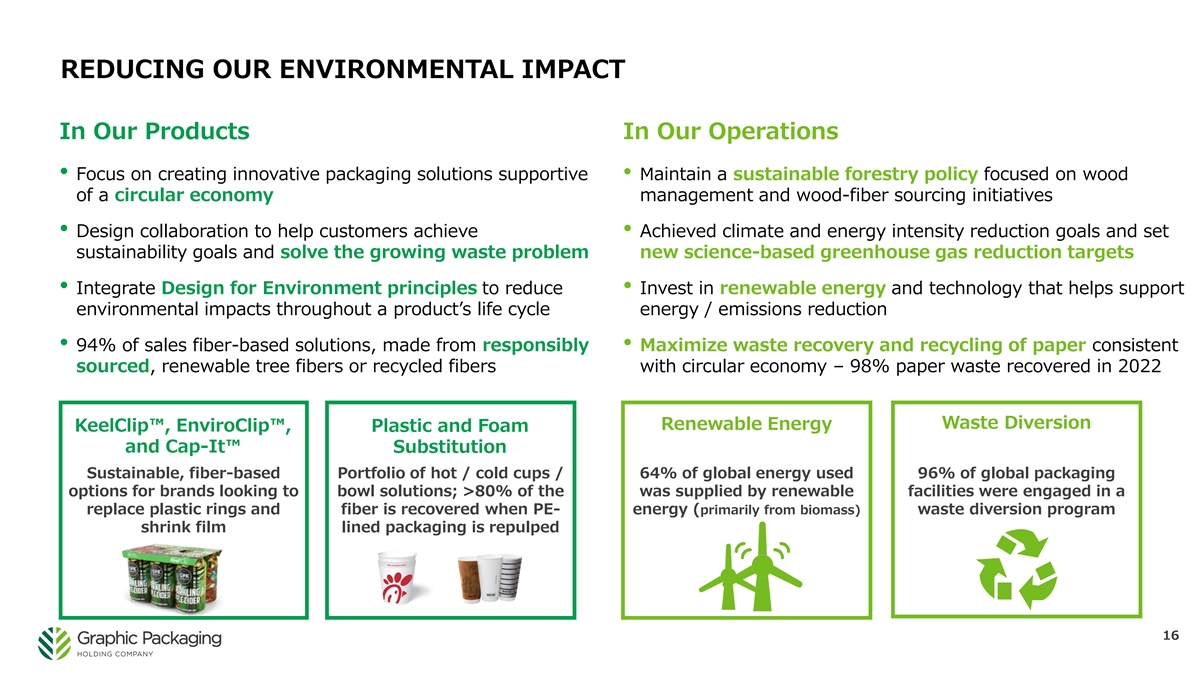
REDUCING OUR ENVIRONMENTAL IMPACT In Our Products In Our Operations • Focus on creating innovative packaging solutions supportive • Maintain a sustainable forestry policy focused on wood of a circular economy management and wood-fiber sourcing initiatives • Design collaboration to help customers achieve • Achieved climate and energy intensity reduction goals and set sustainability goals and solve the growing waste problem new science-based greenhouse gas reduction targets • Integrate Design for Environment principles to reduce • Invest in renewable energy and technology that helps support environmental impacts throughout a product’s life cycle energy / emissions reduction • 94% of sales fiber-based solutions, made from responsibly • Maximize waste recovery and recycling of paper consistent sourced, renewable tree fibers or recycled fibers with circular economy – 98% paper waste recovered in 2022 Waste Diversion Renewable Energy KeelClip™, EnviroClip™, Plastic and Foam and Cap-It™ Substitution Sustainable, fiber-based Portfolio of hot / cold cups / 64% of global energy used 96% of global packaging options for brands looking to bowl solutions; >80% of the was supplied by renewable facilities were engaged in a replace plastic rings and fiber is recovered when PE- energy (primarily from biomass) waste diversion program shrink film lined packaging is repulped 16
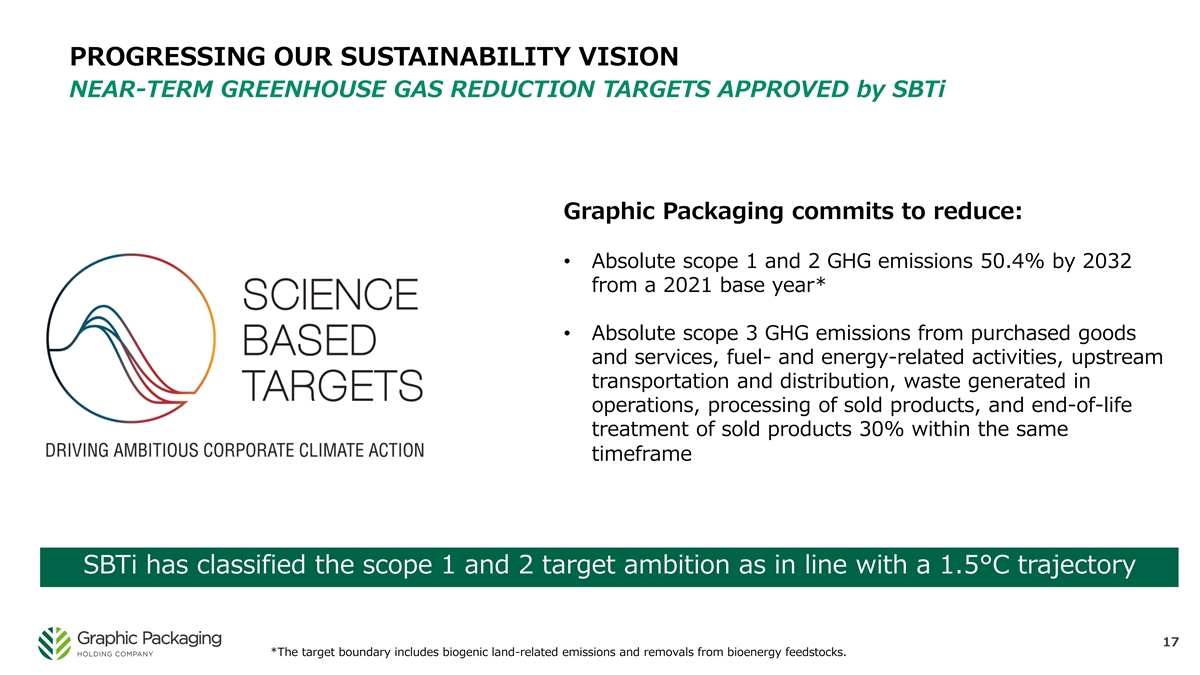
PROGRESSING OUR SUSTAINABILITY VISION NEAR-TERM GREENHOUSE GAS REDUCTION TARGETS APPROVED by SBTi Graphic Packaging commits to reduce: • Absolute scope 1 and 2 GHG emissions 50.4% by 2032 from a 2021 base year* • Absolute scope 3 GHG emissions from purchased goods and services, fuel- and energy-related activities, upstream transportation and distribution, waste generated in operations, processing of sold products, and end-of-life treatment of sold products 30% within the same timeframe SBTi has classified the scope 1 and 2 target ambition as in line with a 1.5°C trajectory 17 *The target boundary includes biogenic land-related emissions and removals from bioenergy feedstocks.
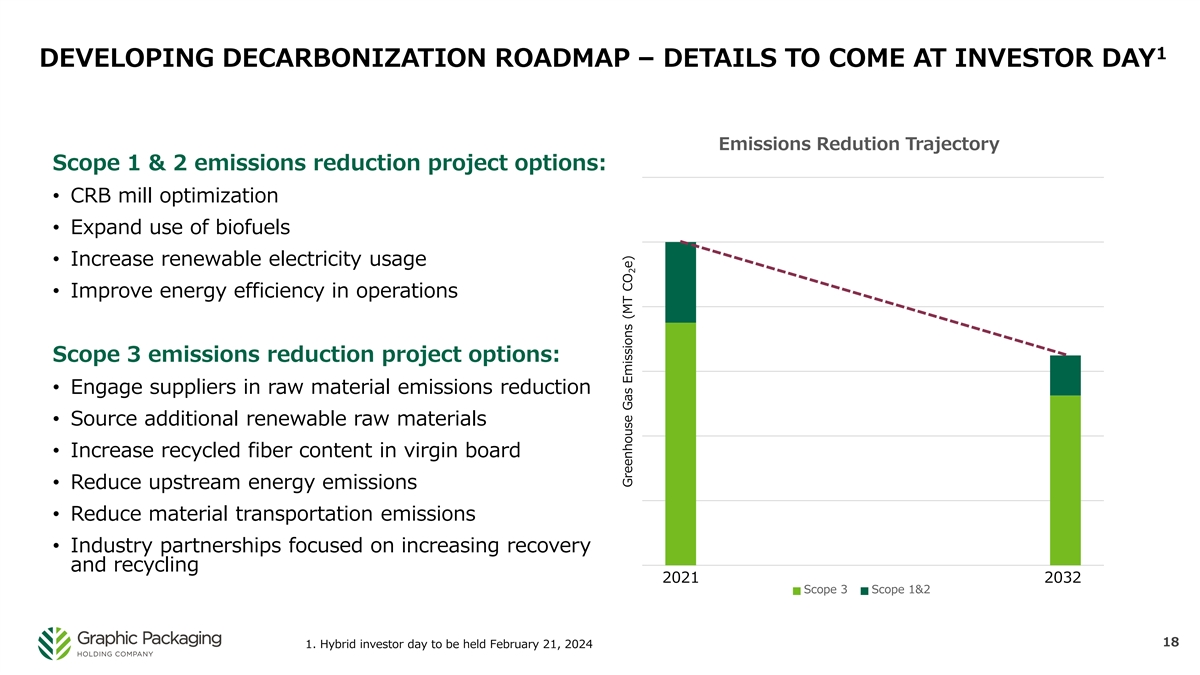
1 DEVELOPING DECARBONIZATION ROADMAP – DETAILS TO COME AT INVESTOR DAY Emissions Redution Trajectory Scope 1 & 2 emissions reduction project options: • CRB mill optimization • Expand use of biofuels • Increase renewable electricity usage • Improve energy efficiency in operations Scope 3 emissions reduction project options: • Engage suppliers in raw material emissions reduction • Source additional renewable raw materials • Increase recycled fiber content in virgin board • Reduce upstream energy emissions • Reduce material transportation emissions • Industry partnerships focused on increasing recovery and recycling 2021 2032 Scope 3 Scope 1&2 18 1. Hybrid investor day to be held February 21, 2024 Greenhouse Gas Emissions (MT CO e) 2
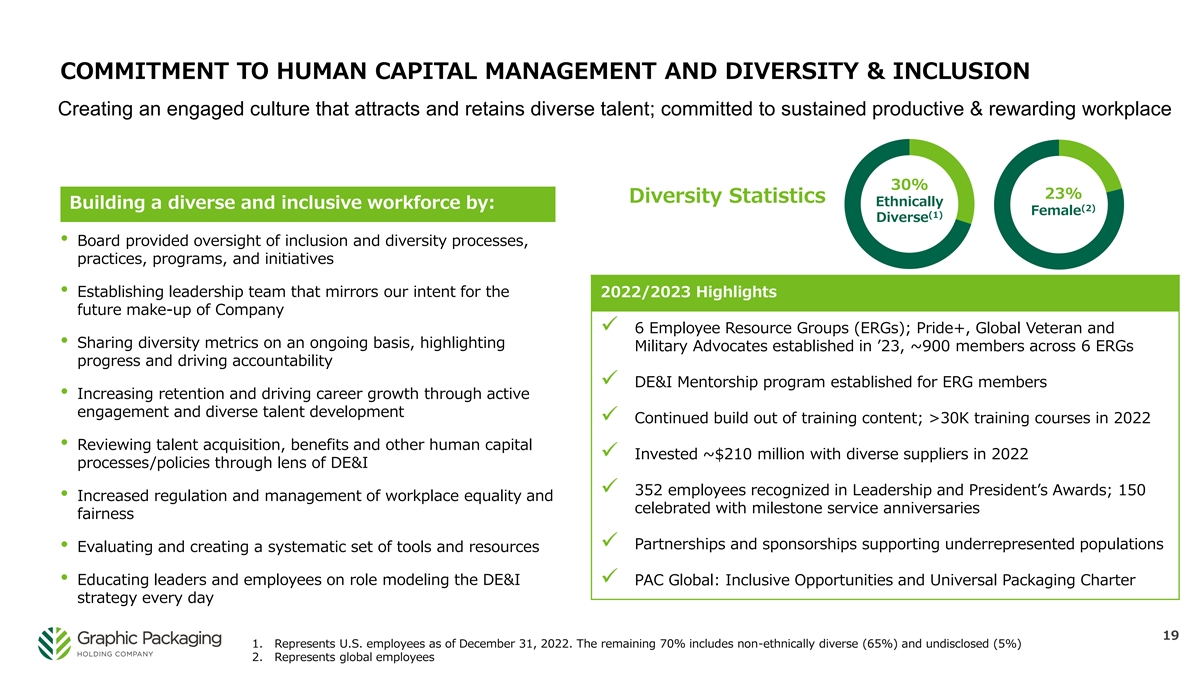
COMMITMENT TO HUMAN CAPITAL MANAGEMENT AND DIVERSITY & INCLUSION Creating an engaged culture that attracts and retains diverse talent; committed to sustained productive & rewarding workplace 30% 23% Diversity Statistics Ethnically Building a diverse and inclusive workforce by: (2) Female (1) Diverse • Board provided oversight of inclusion and diversity processes, practices, programs, and initiatives • Establishing leadership team that mirrors our intent for the 2022/2023 Highlights future make-up of Company ✓ 6 Employee Resource Groups (ERGs); Pride+, Global Veteran and • Sharing diversity metrics on an ongoing basis, highlighting Military Advocates established in ’23, ~900 members across 6 ERGs progress and driving accountability ✓ DE&I Mentorship program established for ERG members • Increasing retention and driving career growth through active engagement and diverse talent development ✓ Continued build out of training content; >30K training courses in 2022 • Reviewing talent acquisition, benefits and other human capital ✓ Invested ~$210 million with diverse suppliers in 2022 processes/policies through lens of DE&I ✓ 352 employees recognized in Leadership and President’s Awards; 150 • Increased regulation and management of workplace equality and celebrated with milestone service anniversaries fairness ✓ Partnerships and sponsorships supporting underrepresented populations • Evaluating and creating a systematic set of tools and resources • Educating leaders and employees on role modeling the DE&I ✓ PAC Global: Inclusive Opportunities and Universal Packaging Charter strategy every day 19 1. Represents U.S. employees as of December 31, 2022. The remaining 70% includes non-ethnically diverse (65%) and undisclosed (5%) 2. Represents global employees

GOVERNANCE
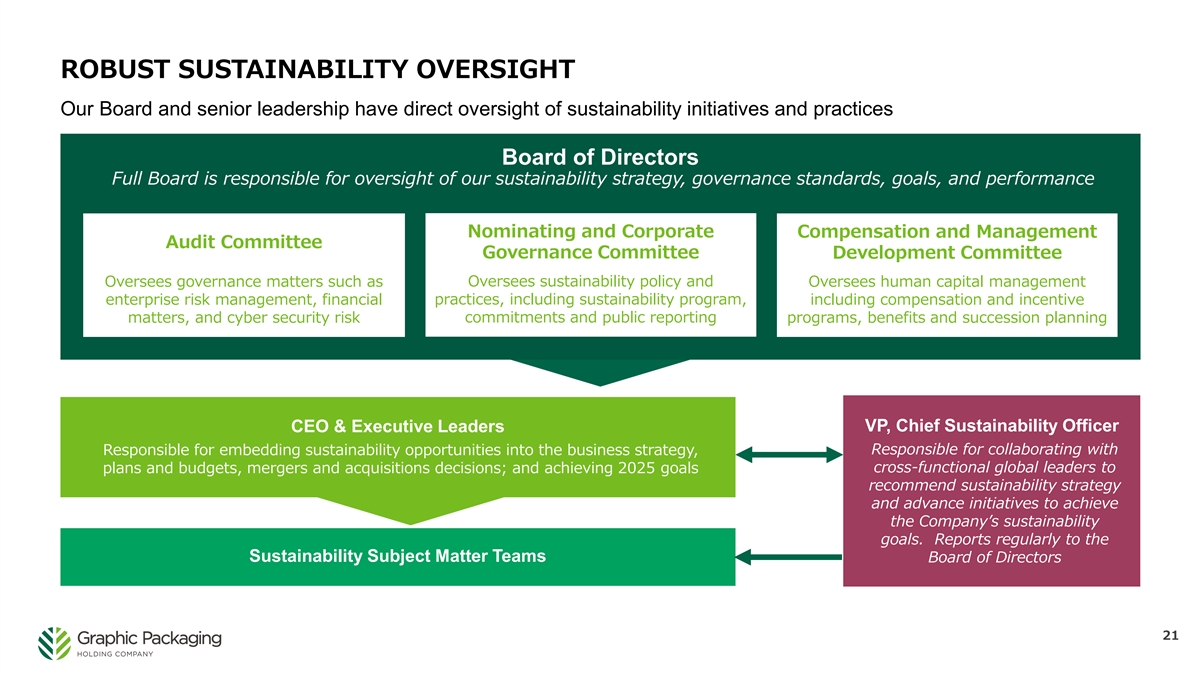
ROBUST SUSTAINABILITY OVERSIGHT Our Board and senior leadership have direct oversight of sustainability initiatives and practices Board of Directors Full Board is responsible for oversight of our sustainability strategy, governance standards, goals, and performance Nominating and Corporate Compensation and Management Audit Committee Governance Committee Development Committee Oversees sustainability policy and Oversees governance matters such as Oversees human capital management enterprise risk management, financial practices, including sustainability program, including compensation and incentive matters, and cyber security risk commitments and public reporting programs, benefits and succession planning VP, Chief Sustainability Officer CEO & Executive Leaders Responsible for embedding sustainability opportunities into the business strategy, Responsible for collaborating with cross-functional global leaders to plans and budgets, mergers and acquisitions decisions; and achieving 2025 goals recommend sustainability strategy and advance initiatives to achieve the Company’s sustainability goals. Reports regularly to the Sustainability Subject Matter Teams Board of Directors 21
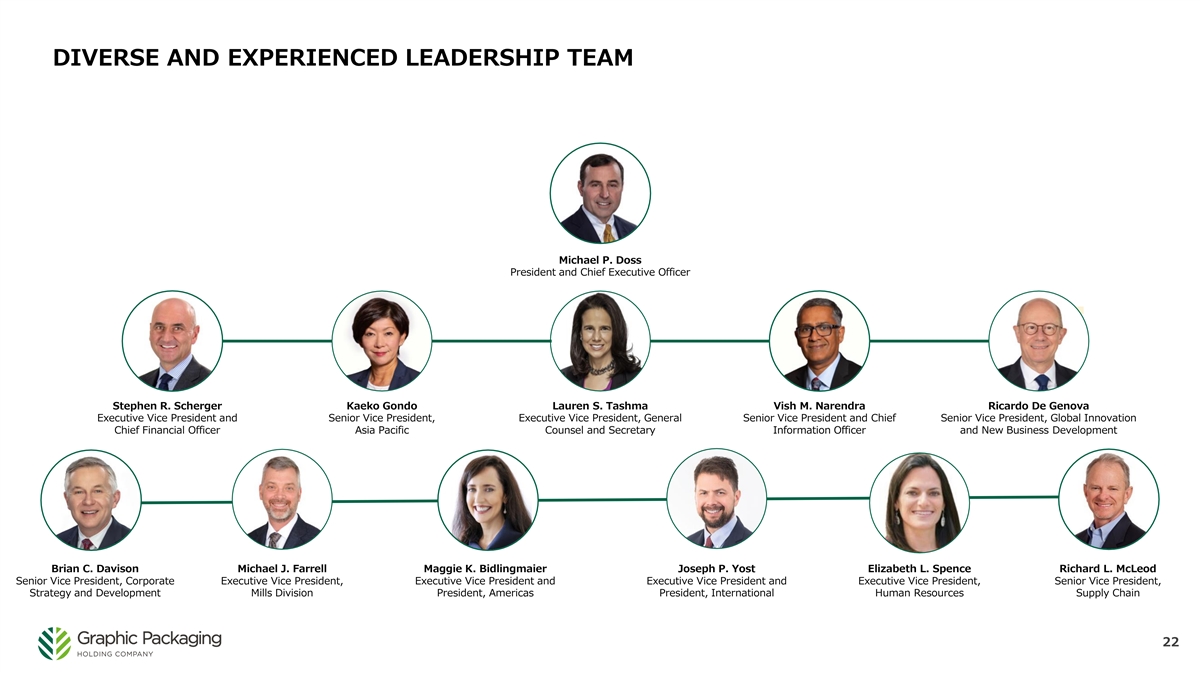
DIVERSE AND EXPERIENCED LEADERSHIP TEAM Michael P. Doss President and Chief Executive Officer Stephen R. Scherger Kaeko Gondo Lauren S. Tashma Vish M. Narendra Ricardo De Genova Executive Vice President and Senior Vice President, Executive Vice President, General Senior Vice President and Chief Senior Vice President, Global Innovation Chief Financial Officer Asia Pacific Counsel and Secretary Information Officer and New Business Development Brian C. Davison Michael J. Farrell Maggie K. Bidlingmaier Joseph P. Yost Elizabeth L. Spence Richard L. McLeod Senior Vice President, Corporate Executive Vice President, Executive Vice President and Executive Vice President and Executive Vice President, Senior Vice President, Strategy and Development Mills Division President, Americas President, International Human Resources Supply Chain 22
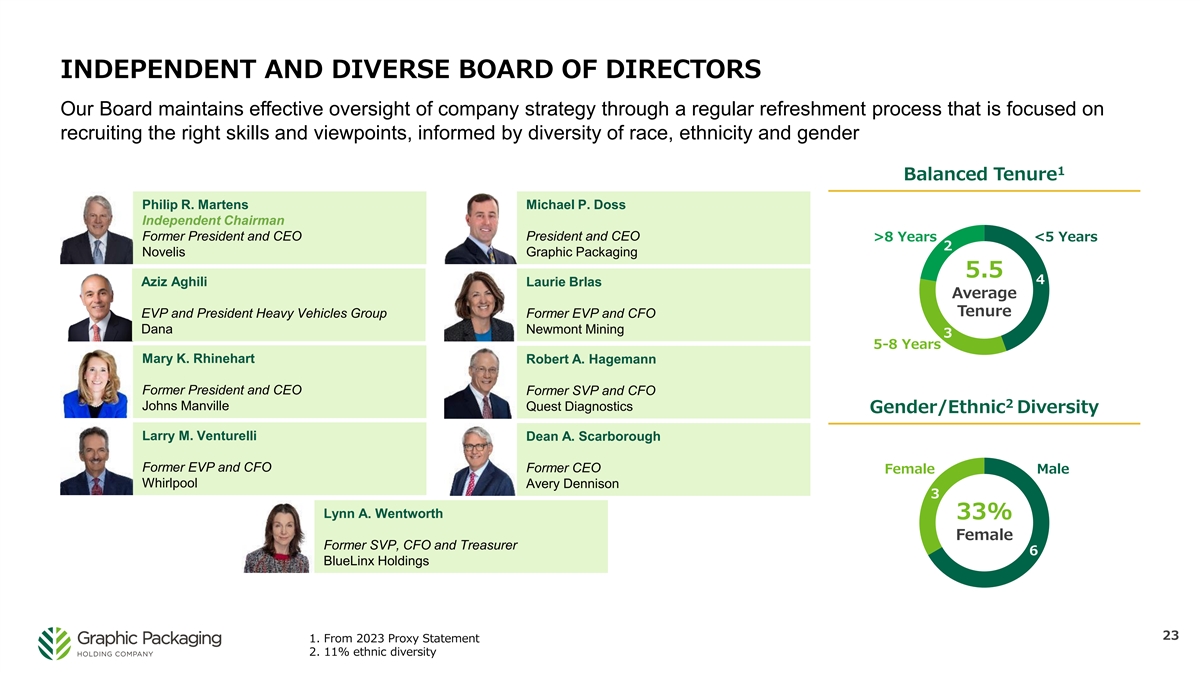
INDEPENDENT AND DIVERSE BOARD OF DIRECTORS Our Board maintains effective oversight of company strategy through a regular refreshment process that is focused on recruiting the right skills and viewpoints, informed by diversity of race, ethnicity and gender 1 Balanced Tenure Philip R. Martens Michael P. Doss Independent Chairman Former President and CEO President and CEO >8 Years <5 Years 2 Novelis Graphic Packaging 5.5 4 Aziz Aghili Laurie Brlas Average Tenure EVP and President Heavy Vehicles Group Former EVP and CFO Dana Newmont Mining 3 5-8 Years Mary K. Rhinehart Robert A. Hagemann Former President and CEO Former SVP and CFO 2 Johns Manville Quest Diagnostics Gender/Ethnic Diversity Larry M. Venturelli Dean A. Scarborough Former EVP and CFO Former CEO Female Male Whirlpool Avery Dennison 3 Lynn A. Wentworth 33% Female Former SVP, CFO and Treasurer 6 BlueLinx Holdings 23 1. From 2023 Proxy Statement 2. 11% ethnic diversity
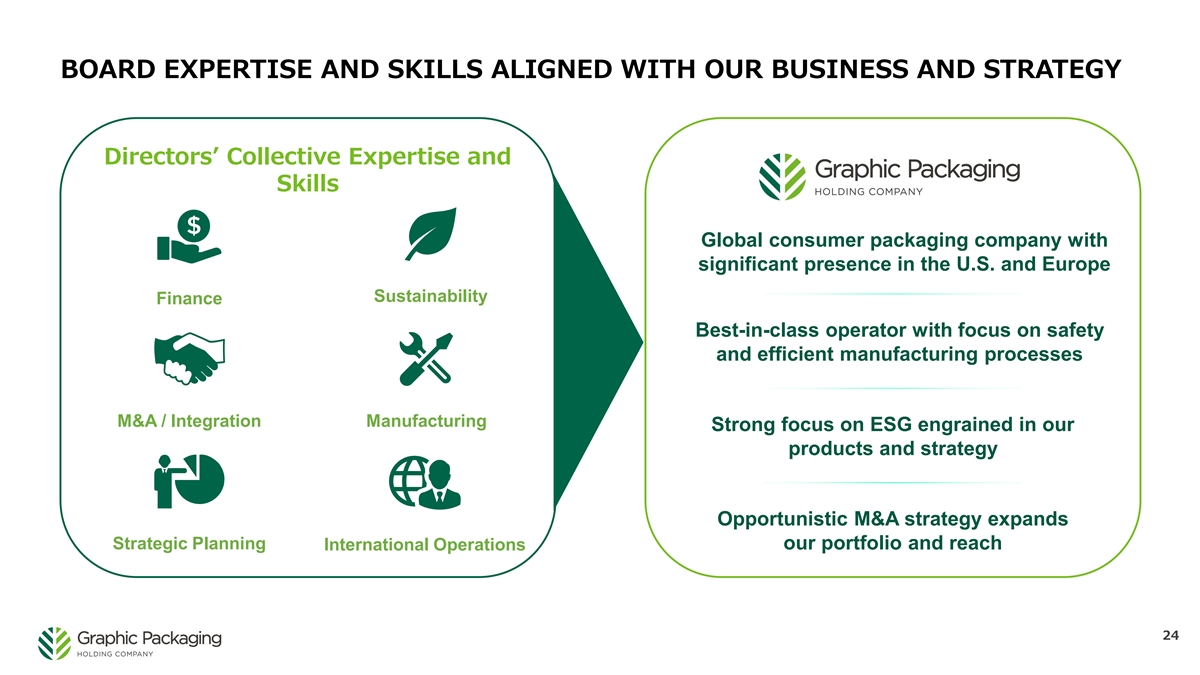
BOARD EXPERTISE AND SKILLS ALIGNED WITH OUR BUSINESS AND STRATEGY Directors’ Collective Expertise and Skills Global consumer packaging company with significant presence in the U.S. and Europe Sustainability Finance Best-in-class operator with focus on safety and efficient manufacturing processes M&A / Integration Manufacturing Strong focus on ESG engrained in our products and strategy Opportunistic M&A strategy expands Strategic Planning our portfolio and reach International Operations 24
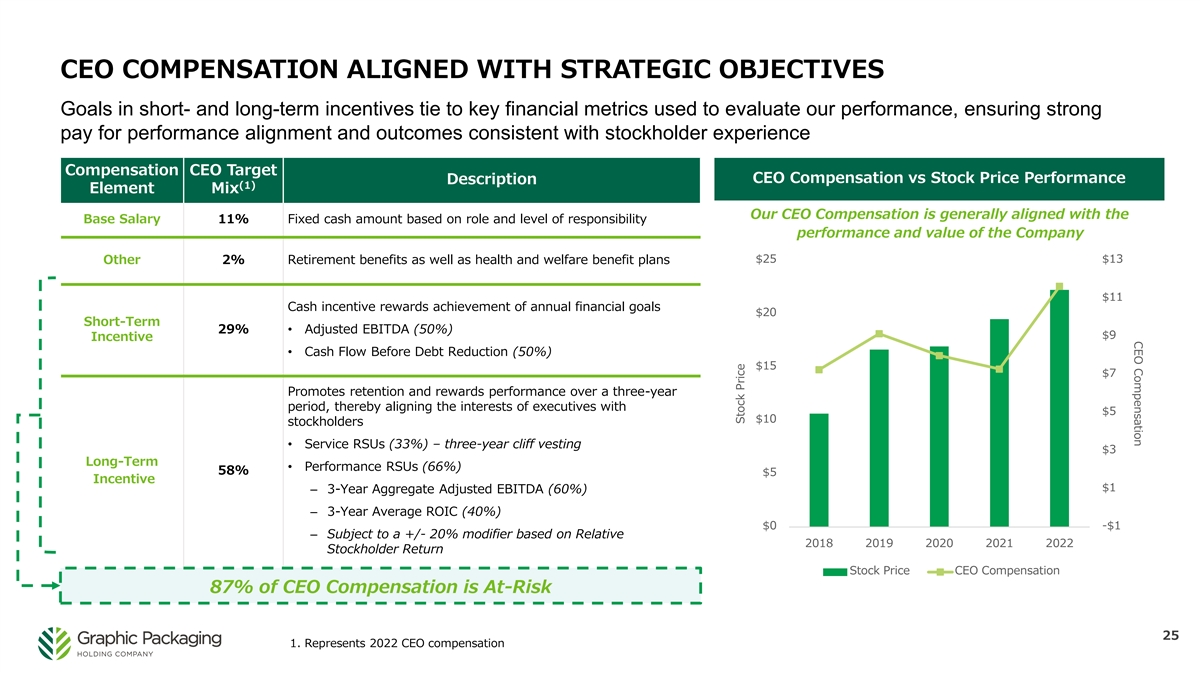
CEO Compensation CEO COMPENSATION ALIGNED WITH STRATEGIC OBJECTIVES Goals in short- and long-term incentives tie to key financial metrics used to evaluate our performance, ensuring strong pay for performance alignment and outcomes consistent with stockholder experience Compensation CEO Target CEO Compensation vs Stock Price Performance Description (1) Element Mix Our CEO Compensation is generally aligned with the Base Salary 11% Fixed cash amount based on role and level of responsibility performance and value of the Company $25 $13 Other 2% Retirement benefits as well as health and welfare benefit plans $11 Cash incentive rewards achievement of annual financial goals $20 Short-Term 29%• Adjusted EBITDA (50%) $9 Incentive • Cash Flow Before Debt Reduction (50%) $15 $7 Promotes retention and rewards performance over a three-year period, thereby aligning the interests of executives with $5 $10 stockholders • Service RSUs (33%) – three-year cliff vesting $3 Long-Term • Performance RSUs (66%) 58% $5 Incentive $1 – 3-Year Aggregate Adjusted EBITDA (60%) – 3-Year Average ROIC (40%) $0 -$1 – Subject to a +/- 20% modifier based on Relative 2018 2019 2020 2021 2022 Stockholder Return Stock Price CEO Compensation 87% of CEO Compensation is At-Risk 25 1. Represents 2022 CEO compensation Stock Price
