EX-99.1
Published on September 26, 2019
Investor Day September 26, 2019 Michael P. Doss Stephen R. Scherger Joseph P. Yost President and Executive Vice President & Executive Vice President & Chief Executive Officer Chief Financial Officer President, Americas Inspired Packaging. A World of Difference.
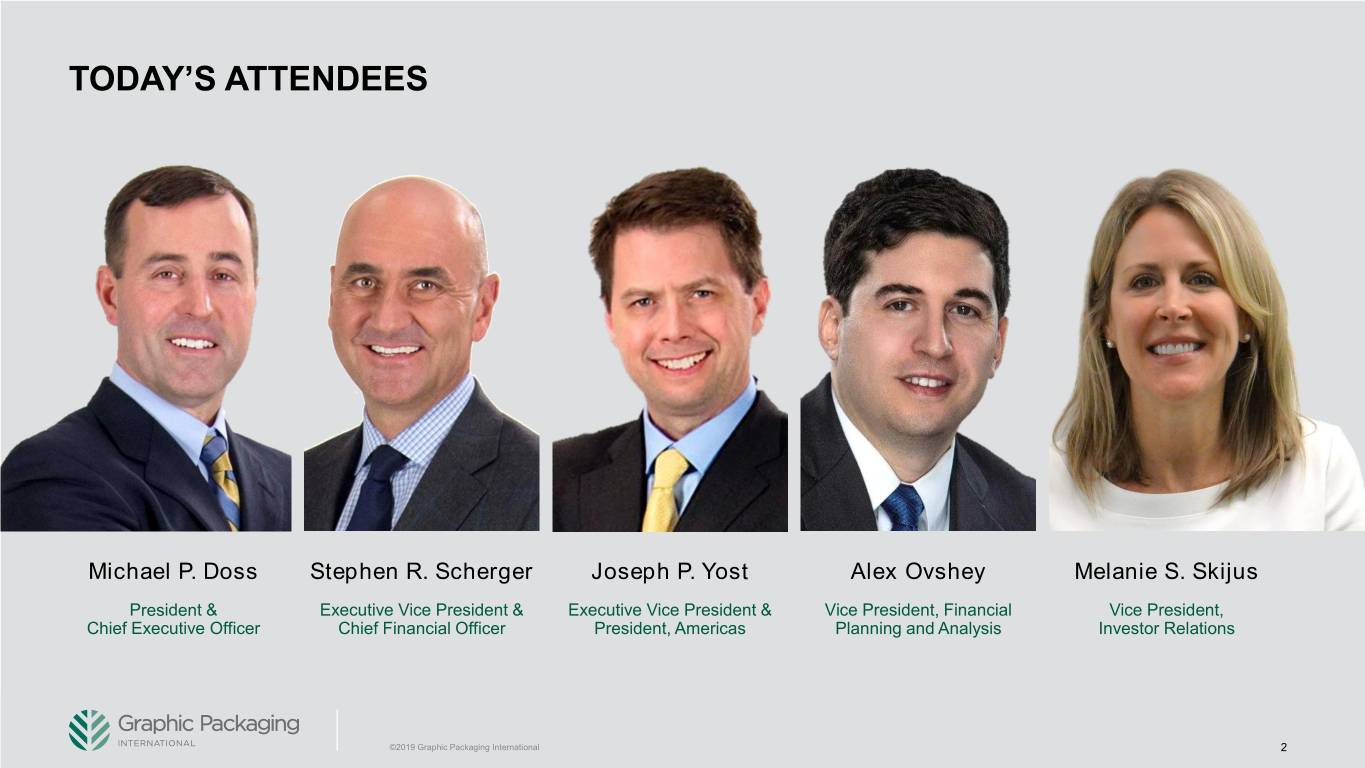
TODAY’S ATTENDEES Michael P. Doss Stephen R. Scherger Joseph P. Yost Alex Ovshey Melanie S. Skijus President & Executive Vice President & Executive Vice President & Vice President, Financial Vice President, Chief Executive Officer Chief Financial Officer President, Americas Planning and Analysis Investor Relations ©2019 Graphic Packaging International 2
FORWARD LOOKING STATEMENTS CAUTIONARY STATEMENT REGARDING FORWARD-LOOKING STATEMENTS Any statements of the Company’s expectations in these slides, including, but not limited to, updated 2019 guidance regarding sales, year-end net debt leverage ratio and capital expenditures; 2020 Adjusted EBITDA, Cash Flow and year-end leverage ratio projections; expected capital expenditures for 2020 and 2021; and future levels of paperboard integration, specific product and total sales, Adjusted EBITDA margins, return on Invested capital and capital expenditures as a percentage of sales; as well as targeted reductions in water usage, energy consumption, greenhouse gases and low-density polyethylene usage constitute “forward-looking statements” as defined in the Private Securities Litigation Reform Act of 1995. Such statements are based on currently available operating, financial and competitive information and are subject to various risks and uncertainties that could cause actual results to differ materially from the Company’s historical experience and its present expectations. These risks and uncertainties include, but are not limited to, inflation of and volatility in raw material and energy costs, changes in consumer buying habits and product preferences, competition with other paperboard manufacturers and product substitution, the Company’s ability to implement its business strategies, including strategic acquisitions, productivity initiatives, cost reduction plans and integration activities, currency movements and other risks of conducting business internationally, and the impact of regulatory and litigation matters, including those that could impact the Company’s ability to utilize its net operating losses to offset taxable income and those that impact the Company’s ability to protect and use its intellectual property. Undue reliance should not be placed on such forward-looking statements, as such statements speak only as of the date on which they are made and the Company undertakes no obligation to update such statements, except as may be required by law. Additional information regarding these and other risks is contained in the Company’s periodic filings with the Securities and Exchange Commission. NON-GAAP FINANCIAL MEASURES This presentation includes certain financial measures that exclude or adjust for charges or income associated with business combinations, facility shutdowns, extended mill outages, sales of assets and other special charges or income. The Company’s management believes that the presentation of these financial measures provides useful information to investors because these measures are regularly used by management in assessing the Company’s performance. These financial measures are not calculated in accordance with generally accepted accounting principles in the United States (“GAAP”) and should be considered in addition to results prepared in accordance with GAAP, but should not be considered substitutes for or superior to GAAP results. In addition, these non-GAAP financial measures may not be comparable to similarly-titled measures utilized by other companies, since such other companies may not calculate such measure in the same manner as we do. A reconciliation of these measures to the most relevant GAAP measure is provided in the appendix to this presentation. ©2019 Graphic Packaging International 3
AGENDA Graphic Packaging Today 2019–2020 Financial Update Vision 2025 Sustainability Supported, Organic Growth Productivity Driven Margin Improvement Financial Flexibility ©2019 Graphic Packaging International 4
GRAPHIC PACKAGING: INVESTMENT CASE • REDEFINING INDUSTRY LEADERSHIP WITH VISION 2025 • CAPTURING SUSTAINABILITY SUPPORTED ORGANIC GROWTH • CLEAR PATH TO DELIVER PRODUCTIVITY DRIVEN MARGIN IMPROVEMENT • STRONG FINANCIAL FLEXIBLITY TO ACHIEVE VISION 2025 • BALANCED CAPITAL ALLOCATION MAXIMIZING SHAREHOLDER RETURN ©2019 Graphic Packaging International 5
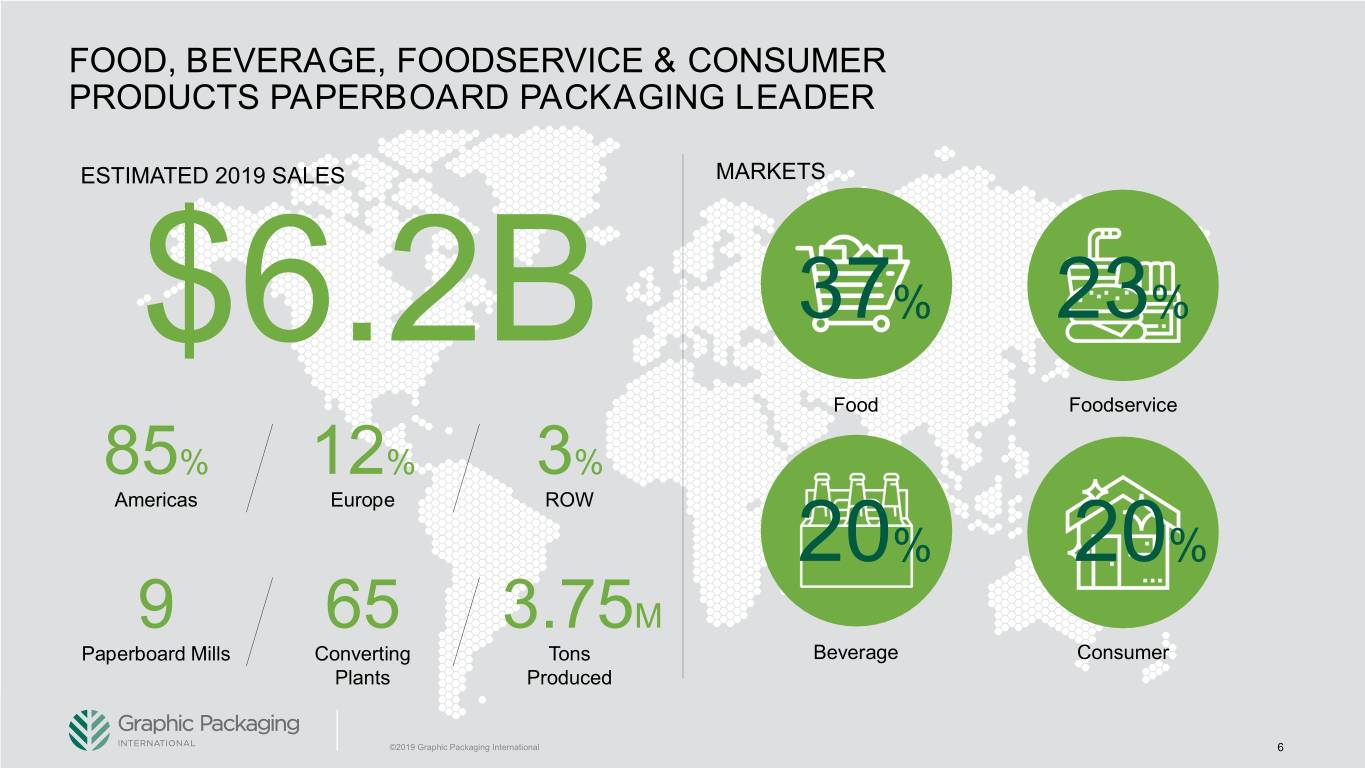
FOOD, BEVERAGE, FOODSERVICE & CONSUMER PRODUCTS PAPERBOARD PACKAGING LEADER ESTIMATED 2019 SALES MARKETS $6.2B 37% 23% Food Foodservice 85% 12% 3% Americas Europe ROW 20% 20% 9 65 3.75M Paperboard Mills Converting Tons Beverage Consumer Plants Produced ©2019 Graphic Packaging International 6
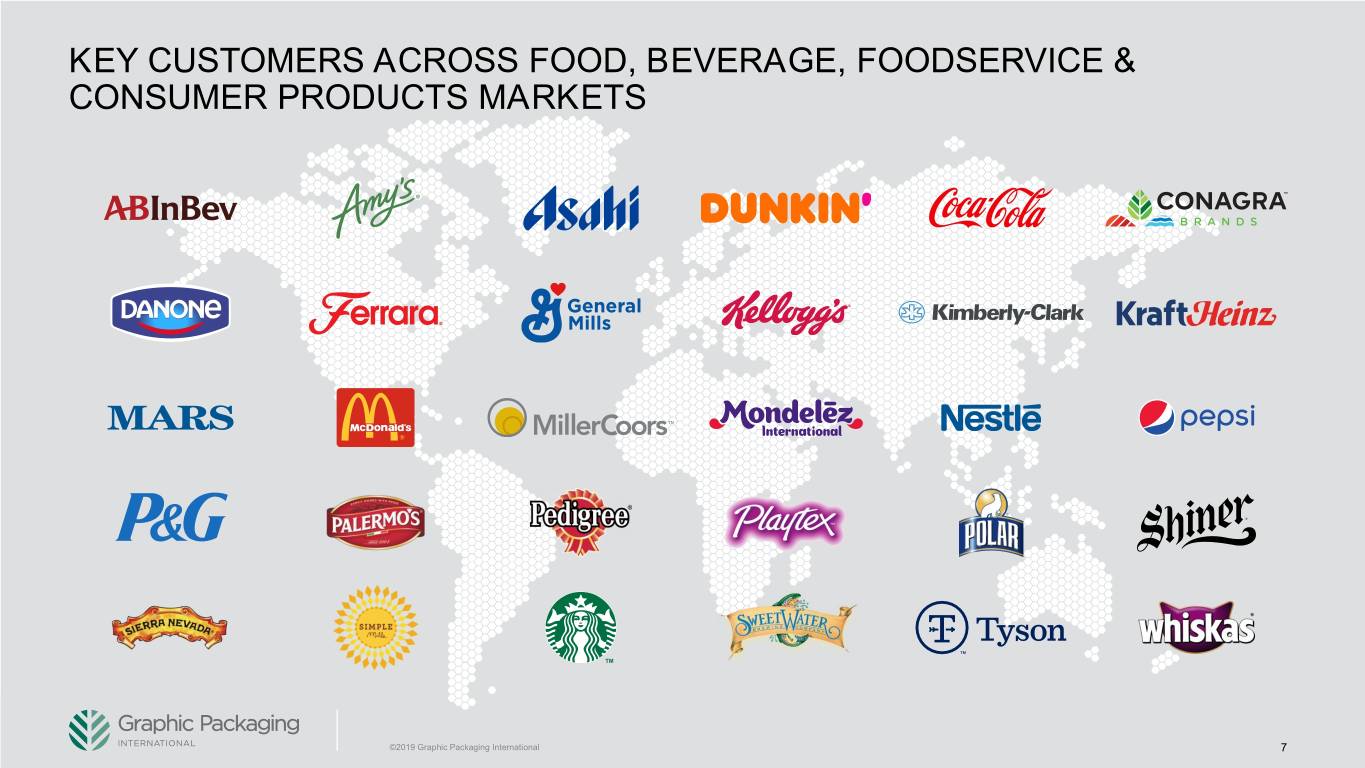
KEY CUSTOMERS ACROSS FOOD, BEVERAGE, FOODSERVICE & CONSUMER PRODUCTS MARKETS ©2019 Graphic Packaging International 7
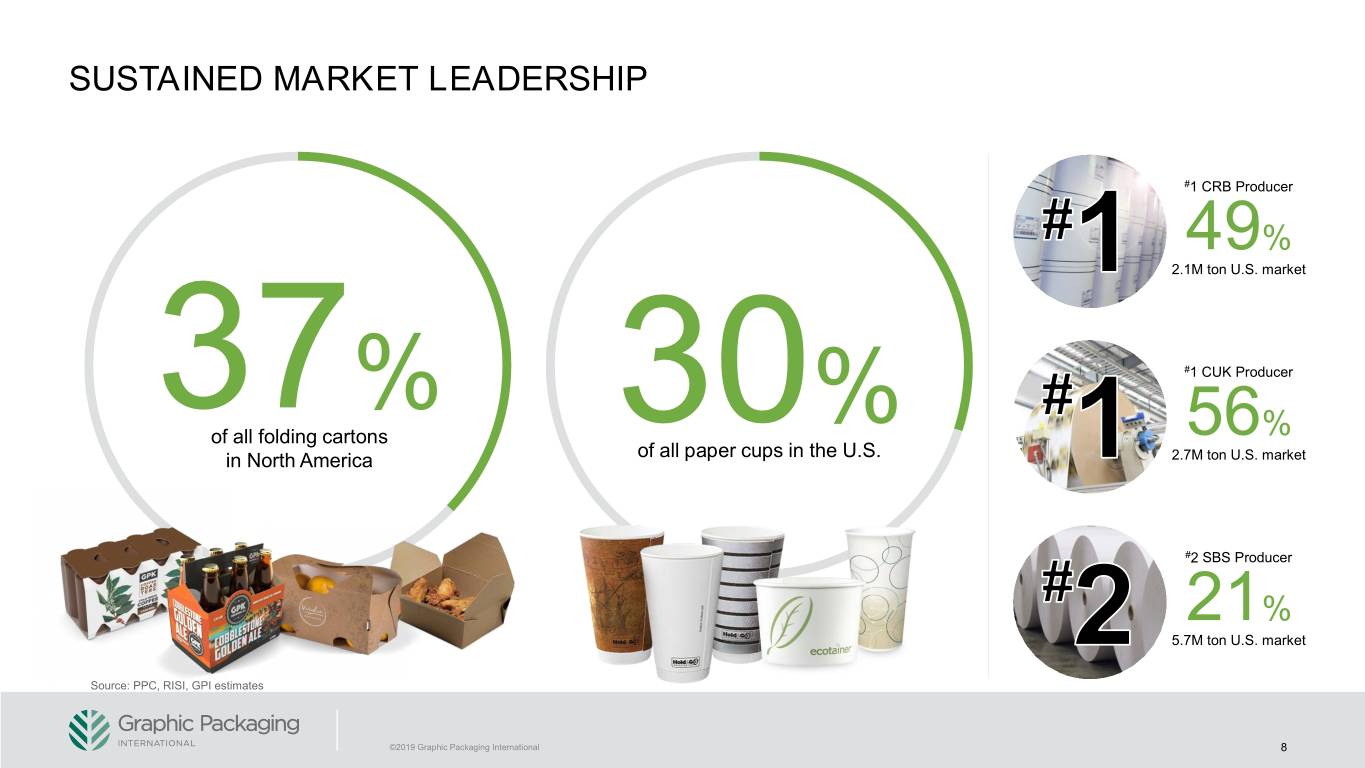
SUSTAINED MARKET LEADERSHIP #1 CRB Producer 49% 2.1M ton U.S. market #1 CUK Producer 37% % % of all folding cartons 30 56 of all paper cups in the U.S. in North America 2.7M ton U.S. market #2 SBS Producer 21% 5.7M ton U.S. market Source: PPC, RISI, GPI estimates ©2019 Graphic Packaging International 8
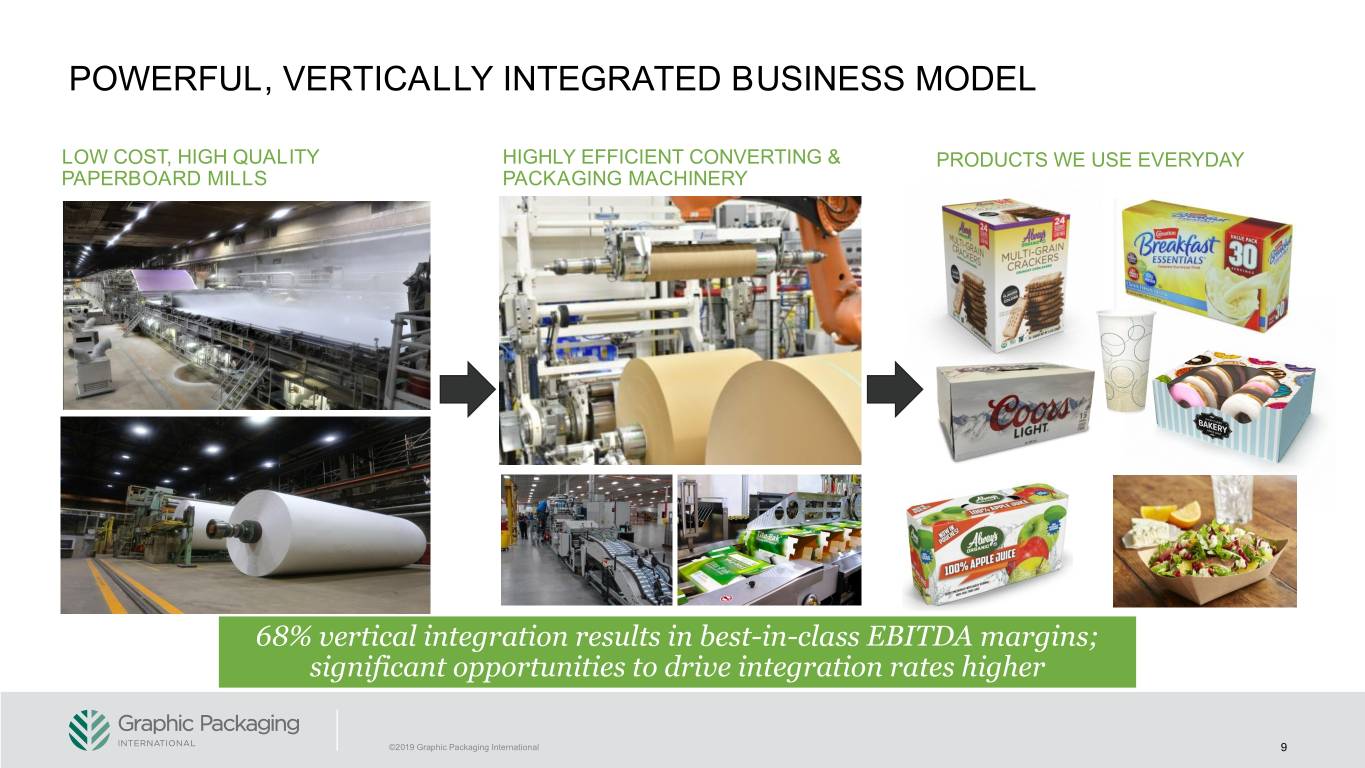
POWERFUL, VERTICALLY INTEGRATED BUSINESS MODEL LOW COST, HIGH QUALITY HIGHLY EFFICIENT CONVERTING & PRODUCTS WE USE EVERYDAY PAPERBOARD MILLS PACKAGING MACHINERY 68% vertical integration results in best-in-class EBITDA margins; significant opportunities to drive integration rates higher ©2019 Graphic Packaging International 9
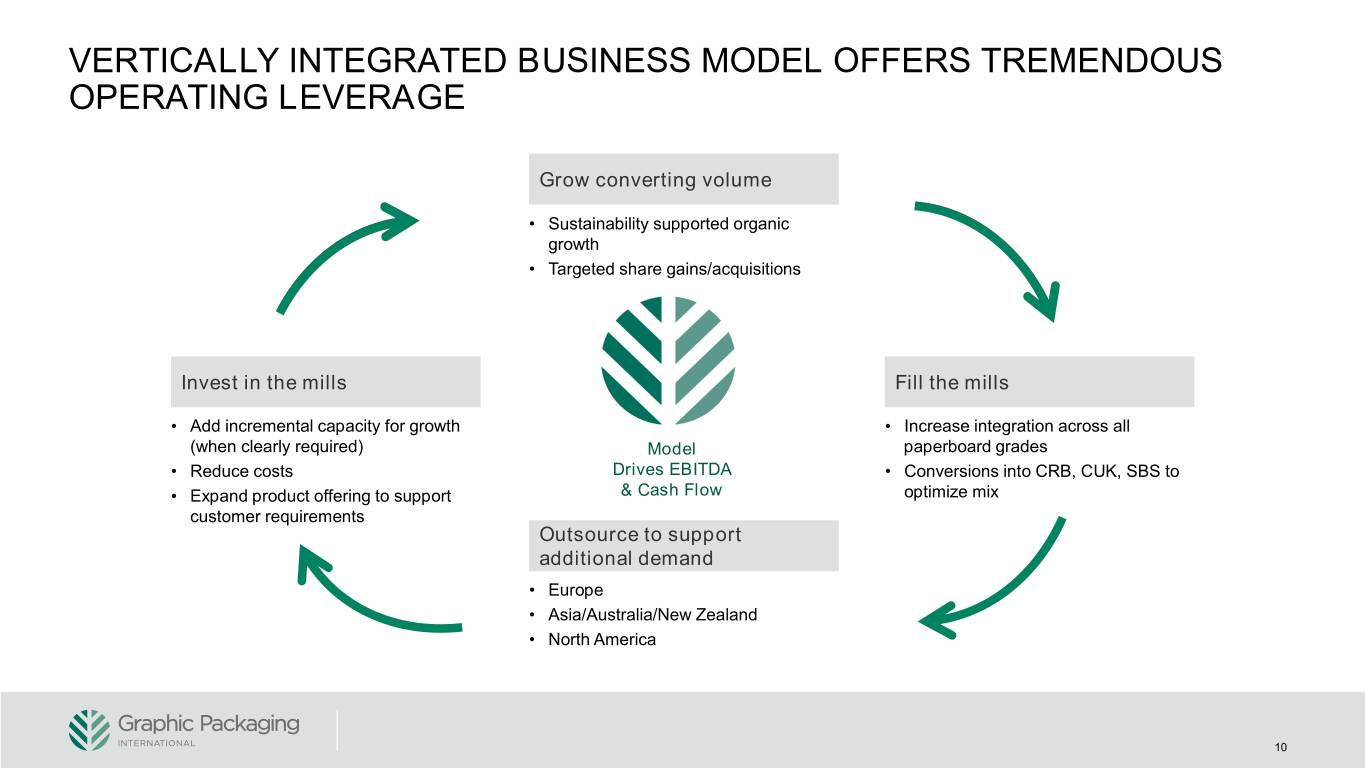
VERTICALLY INTEGRATED BUSINESS MODEL OFFERS TREMENDOUS OPERATING LEVERAGE Grow converting volume • Sustainability supported organic growth • Targeted share gains/acquisitions Invest in the mills Fill the mills • Add incremental capacity for growth • Increase integration across all (when clearly required) Model paperboard grades • Reduce costs Drives EBITDA • Conversions into CRB, CUK, SBS to • Expand product offering to support & Cash Flow optimize mix customer requirements Outsource to support additional demand • Europe • Asia/Australia/New Zealand • North America 10
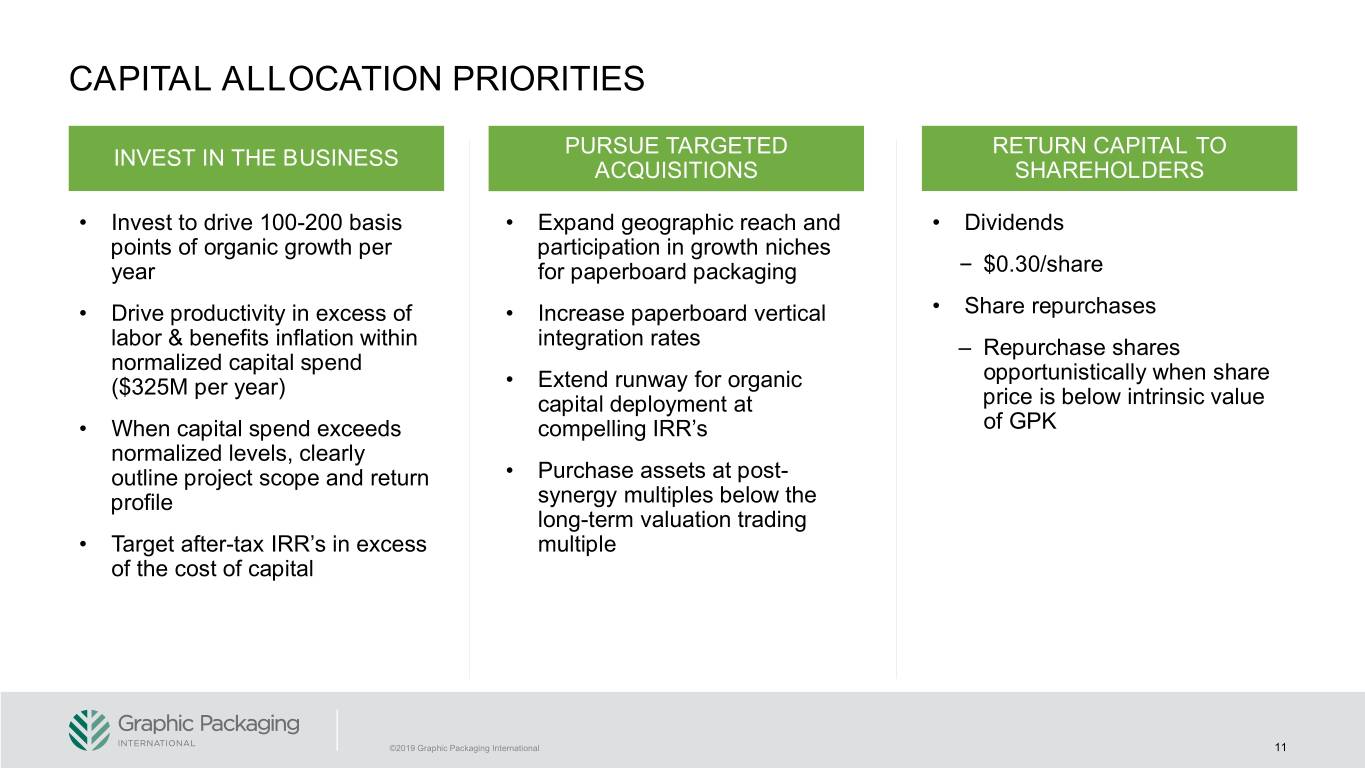
CAPITAL ALLOCATION PRIORITIES PURSUE TARGETED RETURN CAPITAL TO INVEST IN THE BUSINESS ACQUISITIONS SHAREHOLDERS • Invest to drive 100-200 basis • Expand geographic reach and • Dividends points of organic growth per participation in growth niches year for paperboard packaging – $0.30/share • Drive productivity in excess of • Increase paperboard vertical • Share repurchases labor & benefits inflation within integration rates ‒ Repurchase shares normalized capital spend opportunistically when share ($325M per year) • Extend runway for organic capital deployment at price is below intrinsic value • When capital spend exceeds compelling IRR’s of GPK normalized levels, clearly outline project scope and return • Purchase assets at post- profile synergy multiples below the long-term valuation trading • Target after-tax IRR’s in excess multiple of the cost of capital ©2019 Graphic Packaging International 11
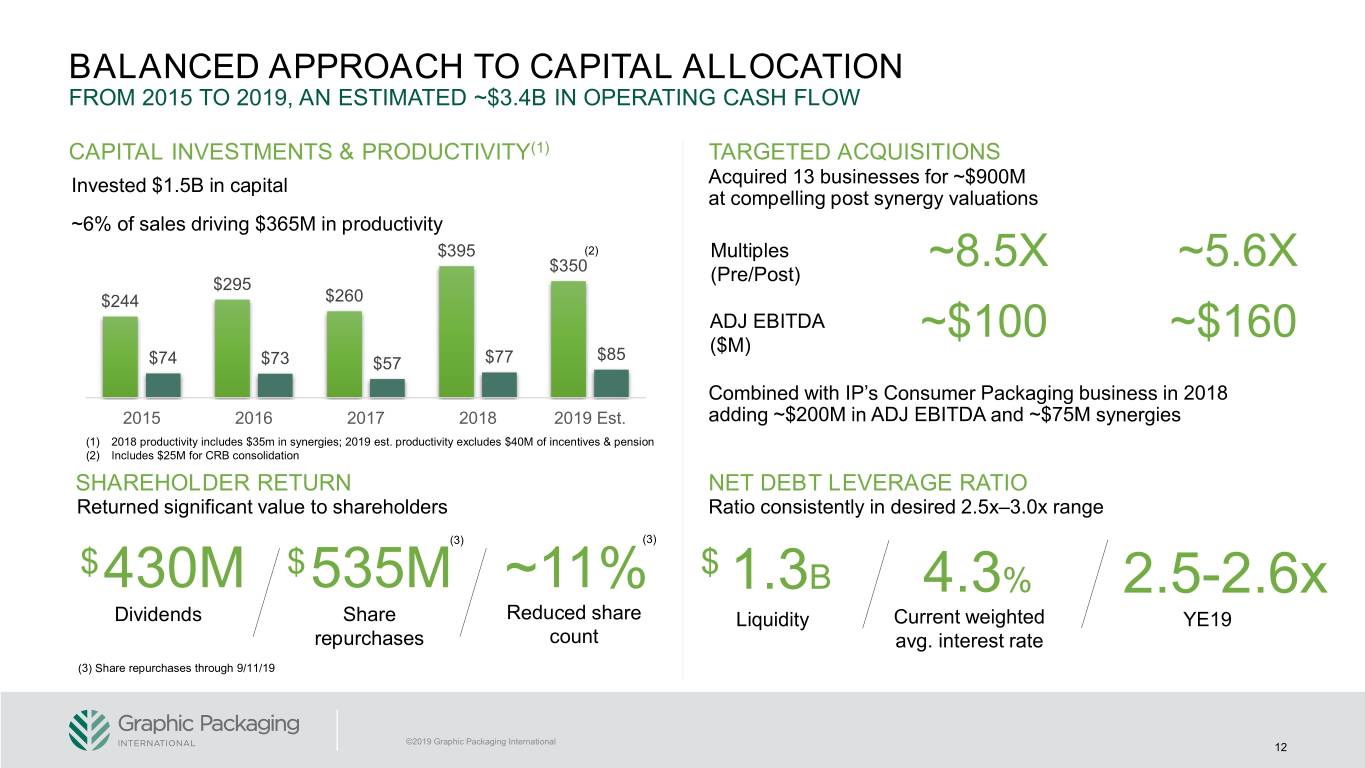
BALANCED APPROACH TO CAPITAL ALLOCATION FROM 2015 TO 2019, AN ESTIMATED ~$3.4B IN OPERATING CASH FLOW CAPITAL INVESTMENTS & PRODUCTIVITY(1) TARGETED ACQUISITIONS Invested $1.5B in capital Acquired 13 businesses for ~$900M at compelling post synergy valuations ~6% of sales driving $365M in productivity $395 (2) Multiples $350 ~8.5X ~5.6X $295 (Pre/Post) $244 $260 ADJ EBITDA ~$100 ~$160 $85 ($M) $74 $73 $57 $77 Combined with IP’s Consumer Packaging business in 2018 2015 2016 2017 2018 2019 Est. adding ~$200M in ADJ EBITDA and ~$75M synergies (1) 2018 productivity includes $35m in synergies; 2019 est. productivity excludes $40M of incentives & pension (2) Includes $25M for CRB consolidation SHAREHOLDER RETURN NET DEBT LEVERAGE RATIO Returned significant value to shareholders Ratio consistently in desired 2.5x–3.0x range (3) (3) $ $ $ 430M 535M ~11% 1.3B 4.3% 2.5-2.6x Dividends Share Reduced share Liquidity Current weighted YE19 repurchases count avg. interest rate (3) Share repurchases through 9/11/19 ©2019 Graphic Packaging International 12
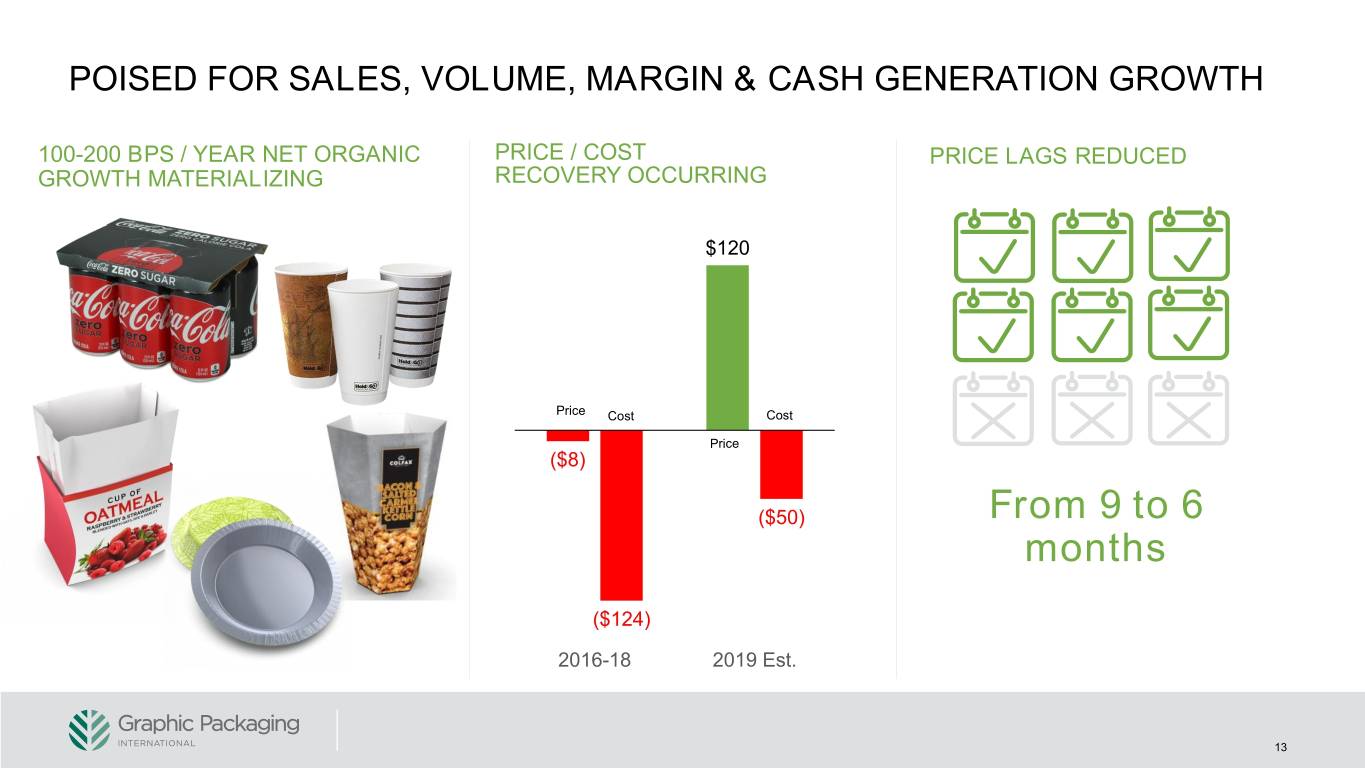
POISED FOR SALES, VOLUME, MARGIN & CASH GENERATION GROWTH 100-200 BPS / YEAR NET ORGANIC PRICE / COST PRICE LAGS REDUCED GROWTH MATERIALIZING RECOVERY OCCURRING $120 Price Cost Cost Price ($8) ($50) From 9 to 6 months ($124) 2016-18 2019 Est. 13
AGENDA Graphic Packaging Today 2019–2020 Financial Update Vision 2025 Sustainability Supported, Organic Growth Productivity Driven Margin Improvement Financial Flexibility ©2019 Graphic Packaging International 14
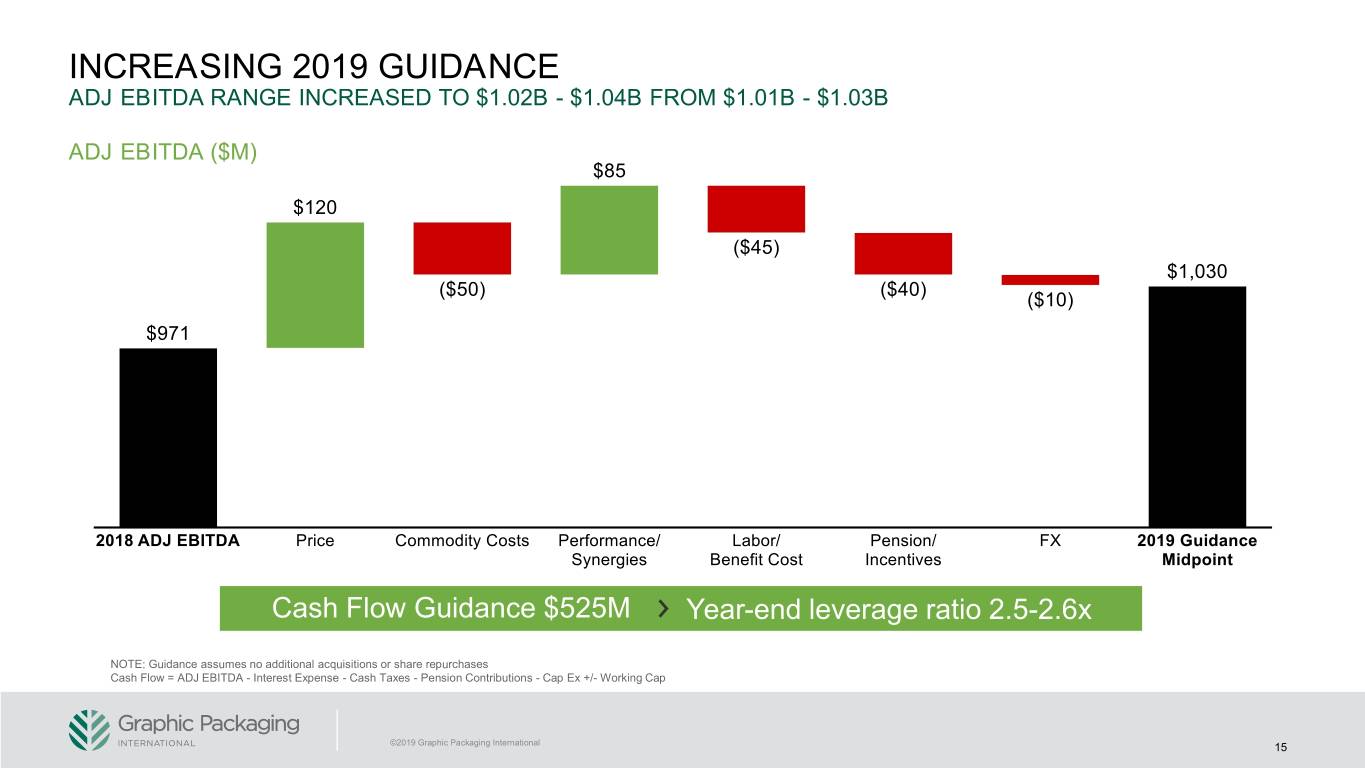
INCREASING 2019 GUIDANCE ADJ EBITDA RANGE INCREASED TO $1.02B - $1.04B FROM $1.01B - $1.03B ADJ EBITDA ($M) Cash Flow Guidance $525M Year-end leverage ratio 2.5-2.6x NOTE: Guidance assumes no additional acquisitions or share repurchases Cash Flow = ADJ EBITDA - Interest Expense - Cash Taxes - Pension Contributions - Cap Ex +/- Working Cap ©2019 Graphic Packaging International 15
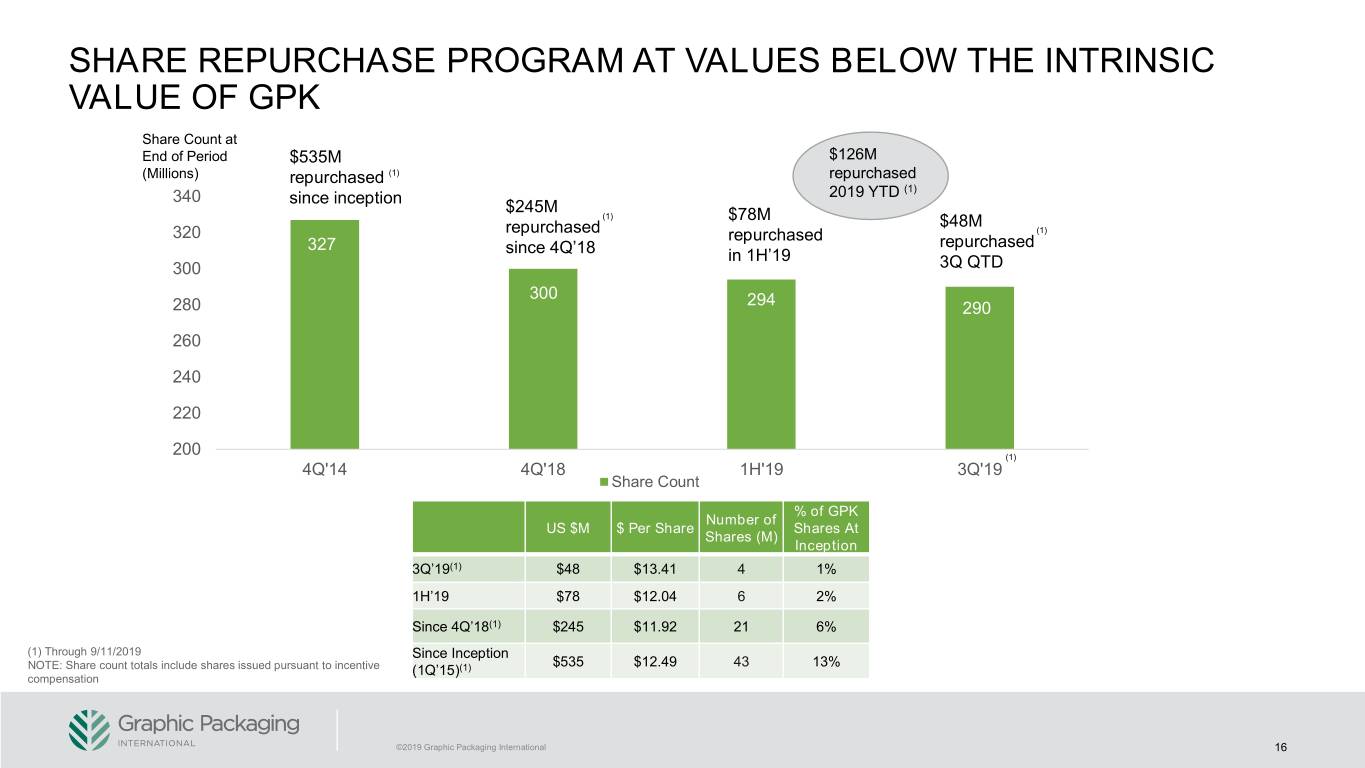
SHARE REPURCHASE PROGRAM AT VALUES BELOW THE INTRINSIC VALUE OF GPK Share Count at End of Period $535M $126M (Millions) repurchased (1) repurchased (1) 340 since inception 2019 YTD $245M (1) $78M $48M 320 repurchased repurchased (1) 327 repurchased since 4Q’18 in 1H’19 300 3Q QTD 300 294 280 290 ~80M 260 240 220 200 (1) 4Q'14 4Q'18 1H'19 3Q'19 ~290M Share Count % of GPK Number of US $M $ Per Share Shares At Shares (M) Inception 3Q’19(1) $48 $13.41 4 1% 1H’19 $78 $12.04 6 2% Since 4Q’18(1) $245 $11.92 21 6% (1) Through 9/11/2019 Since Inception $535 $12.49 43 13% NOTE: Share count totals include shares issued pursuant to incentive (1Q’15)(1) compensation ©2019 Graphic Packaging International 16
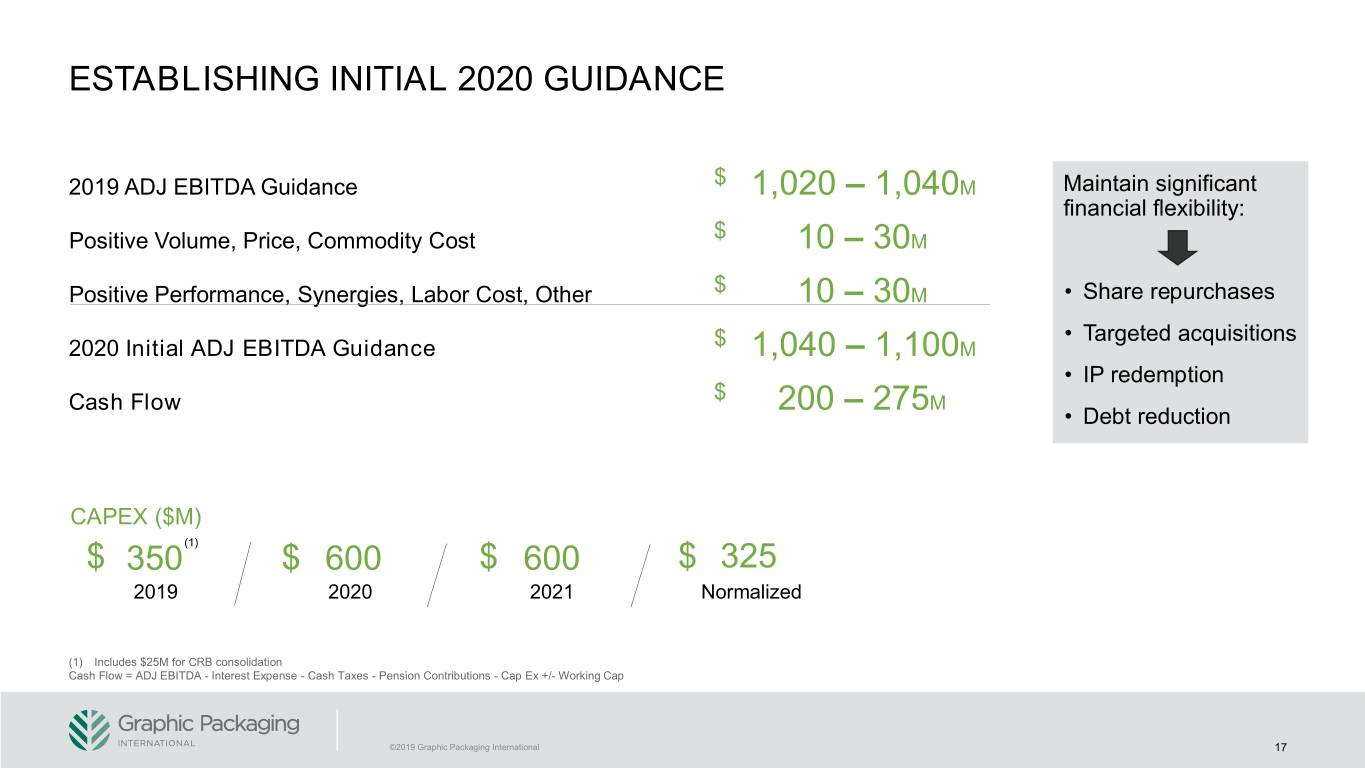
ESTABLISHING INITIAL 2020 GUIDANCE $ 2019 ADJ EBITDA Guidance 1,020 – 1,040M Maintain significant financial flexibility: $ Positive Volume, Price, Commodity Cost 10 – 30M $ Positive Performance, Synergies, Labor Cost, Other 10 – 30M • Share repurchases $ • Targeted acquisitions 2020 Initial ADJ EBITDA Guidance 1,040 – 1,100M • IP redemption $ Cash Flow 200 – 275M • Debt reduction CAPEX ($M) $ 350(1) $ 600 $ 600 $ 325 2019 2020 2021 Normalized (1) Includes $25M for CRB consolidation Cash Flow = ADJ EBITDA - Interest Expense - Cash Taxes - Pension Contributions - Cap Ex +/- Working Cap ©2019 Graphic Packaging International 17
AGENDA Graphic Packaging Today 2019–2020 Financial Update Vision 2025 Sustainability Supported, Organic Growth Productivity Driven Margin Improvement Financial Flexibility ©2019 Graphic Packaging International 18
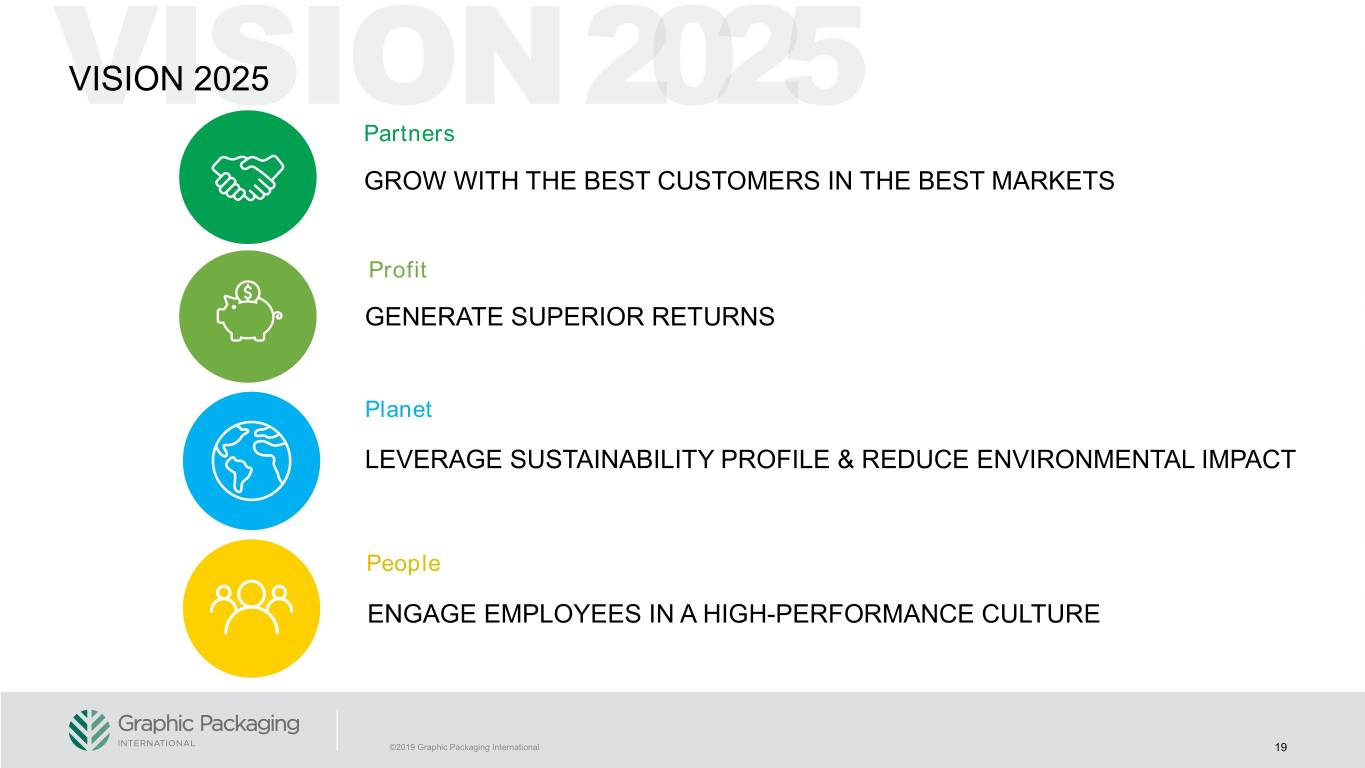
VISION 2025 Partners GROW WITH THE BEST CUSTOMERS IN THE BEST MARKETS Profit GENERATE SUPERIOR RETURNS Planet LEVERAGE SUSTAINABILITY PROFILE & REDUCE ENVIRONMENTAL IMPACT People ENGAGE EMPLOYEES IN A HIGH-PERFORMANCE CULTURE ©2019 Graphic Packaging International 19
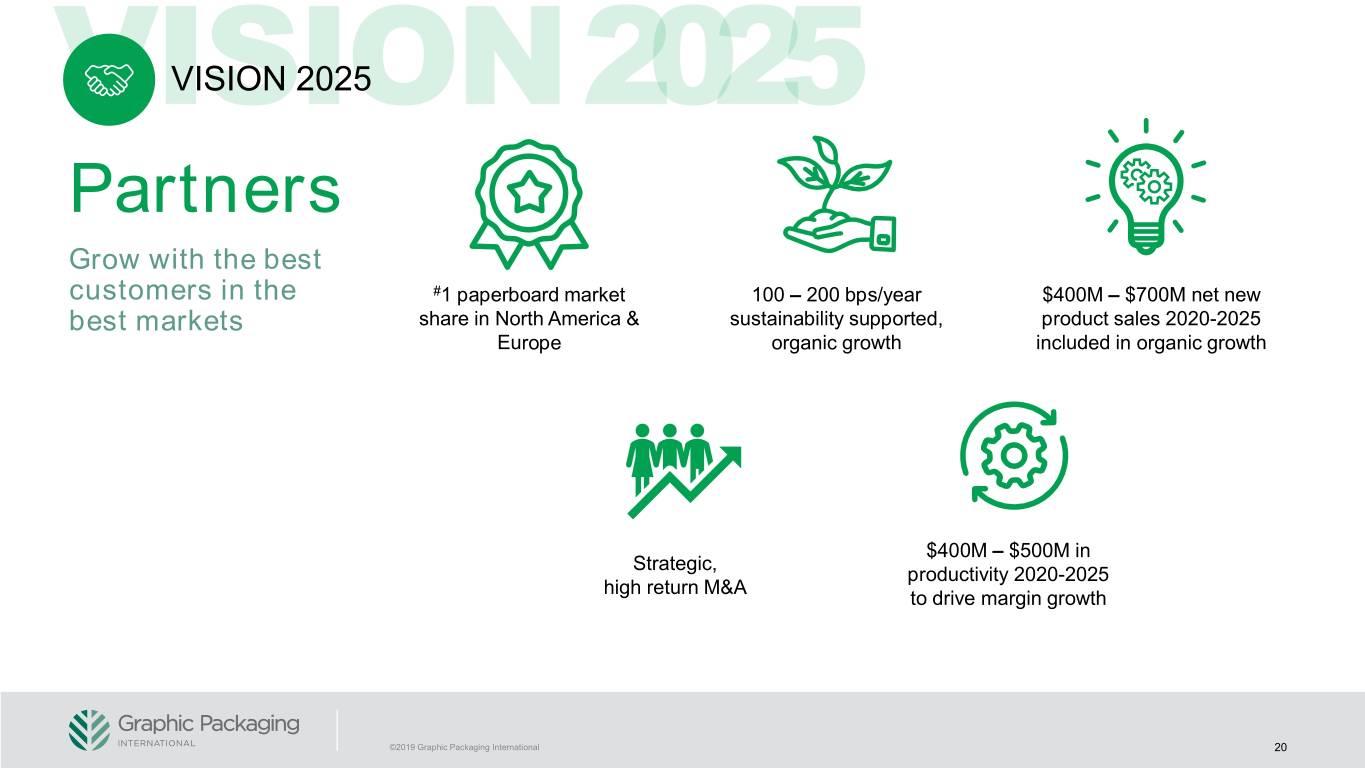
VISION 2025 Partners Grow with the best customers in the #1 paperboard market 100 – 200 bps/year $400M – $700M net new best markets share in North America & sustainability supported, product sales 2020-2025 Europe organic growth included in organic growth $400M – $500M in Strategic, productivity 2020-2025 high return M&A to drive margin growth ©2019 Graphic Packaging International 20
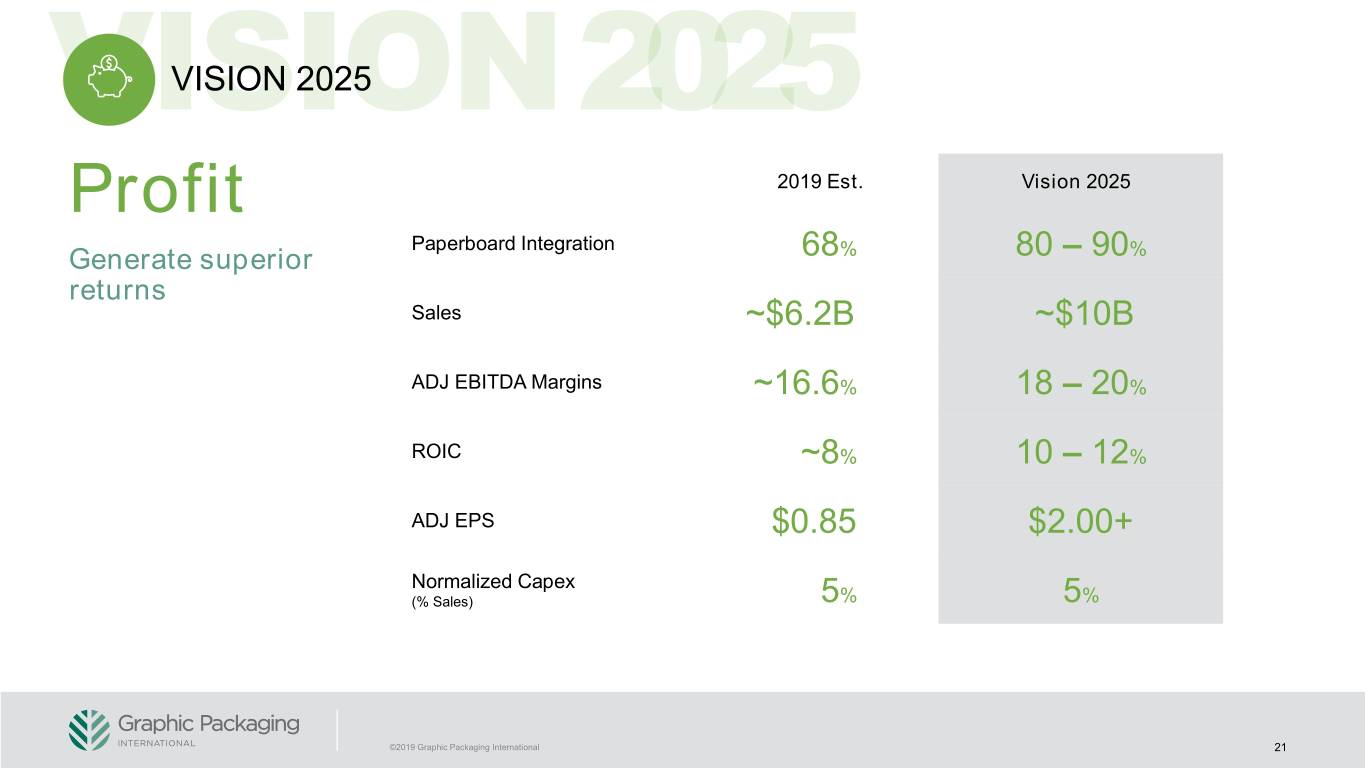
VISION 2025 Profit 2019 Est. Vision 2025 Paperboard Integration Generate superior 68% 80 – 90% returns Sales ~$6.2B ~$10B ADJ EBITDA Margins ~16.6% 18 – 20% ROIC ~8% 10 – 12% ADJ EPS $0.85 $2.00+ Normalized Capex (% Sales) 5% 5% ©2019 Graphic Packaging International 21
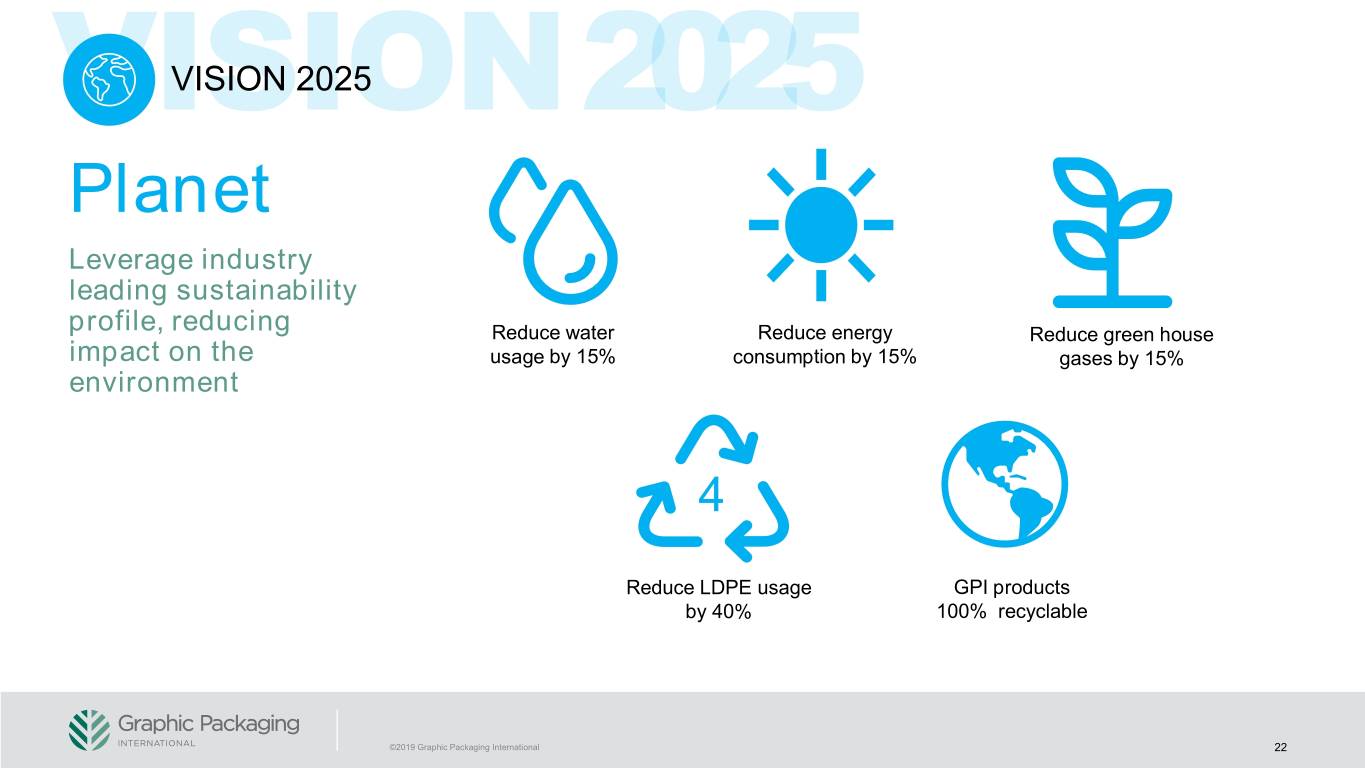
VISION 2025 Planet Leverage industry leading sustainability profile, reducing Reduce water Reduce energy Reduce green house impact on the usage by 15% consumption by 15% gases by 15% environment 4 Reduce LDPE usage GPI products by 40% 100% recyclable ©2019 Graphic Packaging International 22
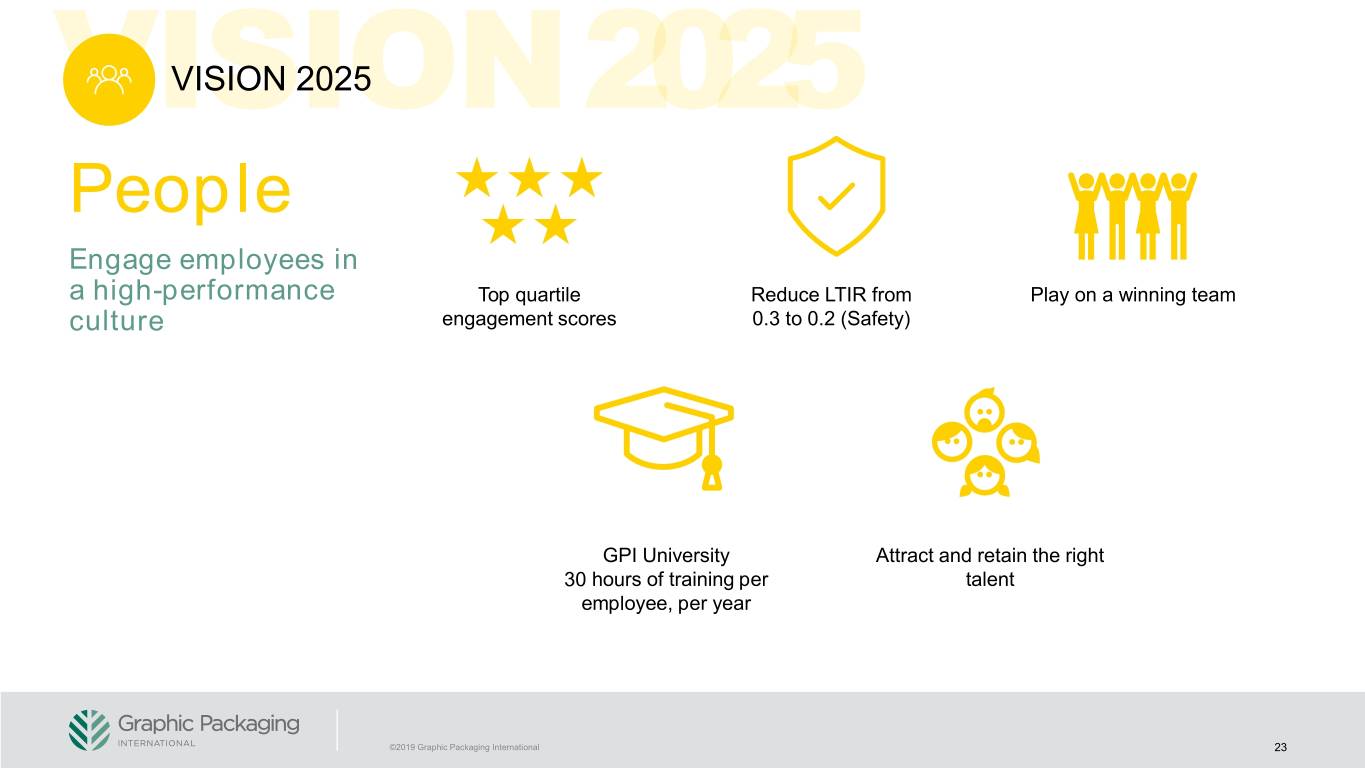
VISION 2025 People Engage employees in a high-performance Top quartile Reduce LTIR from Play on a winning team culture engagement scores 0.3 to 0.2 (Safety) GPI University Attract and retain the right 30 hours of training per talent employee, per year ©2019 Graphic Packaging International 23
AGENDA Graphic Packaging Today 2019–2020 Financial Update Vision 2025 Sustainability Supported, Organic Growth Productivity Driven Margin Improvement Financial Flexibility ©2019 Graphic Packaging International 24
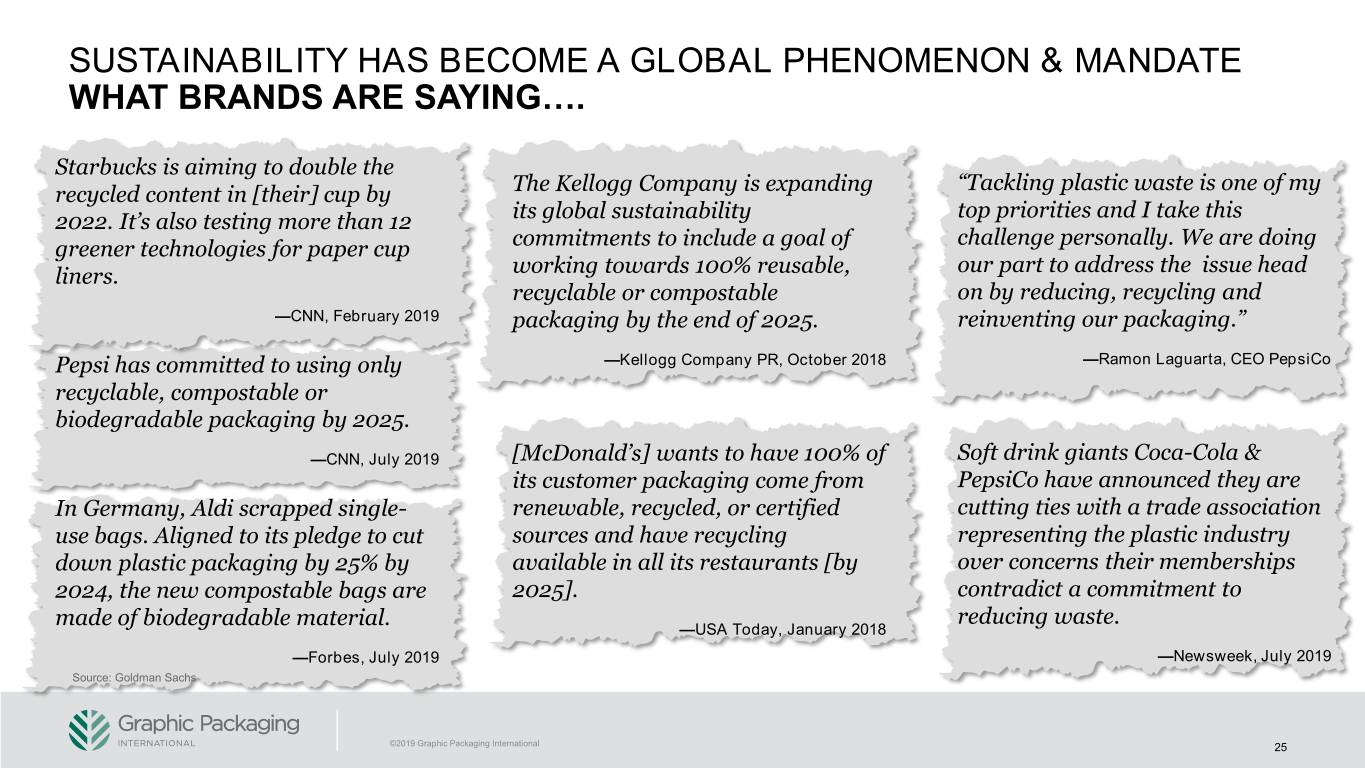
SUSTAINABILITY HAS BECOME A GLOBAL PHENOMENON & MANDATE WHAT BRANDS ARE SAYING…. Starbucks is aiming to double the “Tackling plastic waste is one of my recycled content in [their] cup by The Kellogg Company is expanding top priorities and I take this 2022. It’s also testing more than 12 its global sustainability challenge personally. We are doing greener technologies for paper cup commitments to include a goal of our part to address the issue head liners. working towards 100% reusable, recyclable or compostable on by reducing, recycling and —CNN, February 2019 packaging by the end of 2025. reinventing our packaging.” Pepsi has committed to using only —Kellogg Company PR, October 2018 —Ramon Laguarta, CEO PepsiCo recyclable, compostable or biodegradable packaging by 2025. —CNN, July 2019 [McDonald’s] wants to have 100% of Soft drink giants Coca-Cola & its customer packaging come from PepsiCo have announced they are In Germany, Aldi scrapped single- renewable, recycled, or certified cutting ties with a trade association use bags. Aligned to its pledge to cut sources and have recycling representing the plastic industry down plastic packaging by 25% by available in all its restaurants [by over concerns their memberships 2024, the new compostable bags are 2025]. contradict a commitment to made of biodegradable material. reducing waste. —USA Today, January 2018 —Forbes, July 2019 —Newsweek, July 2019 Source: Goldman Sachs ©2019 Graphic Packaging International 25
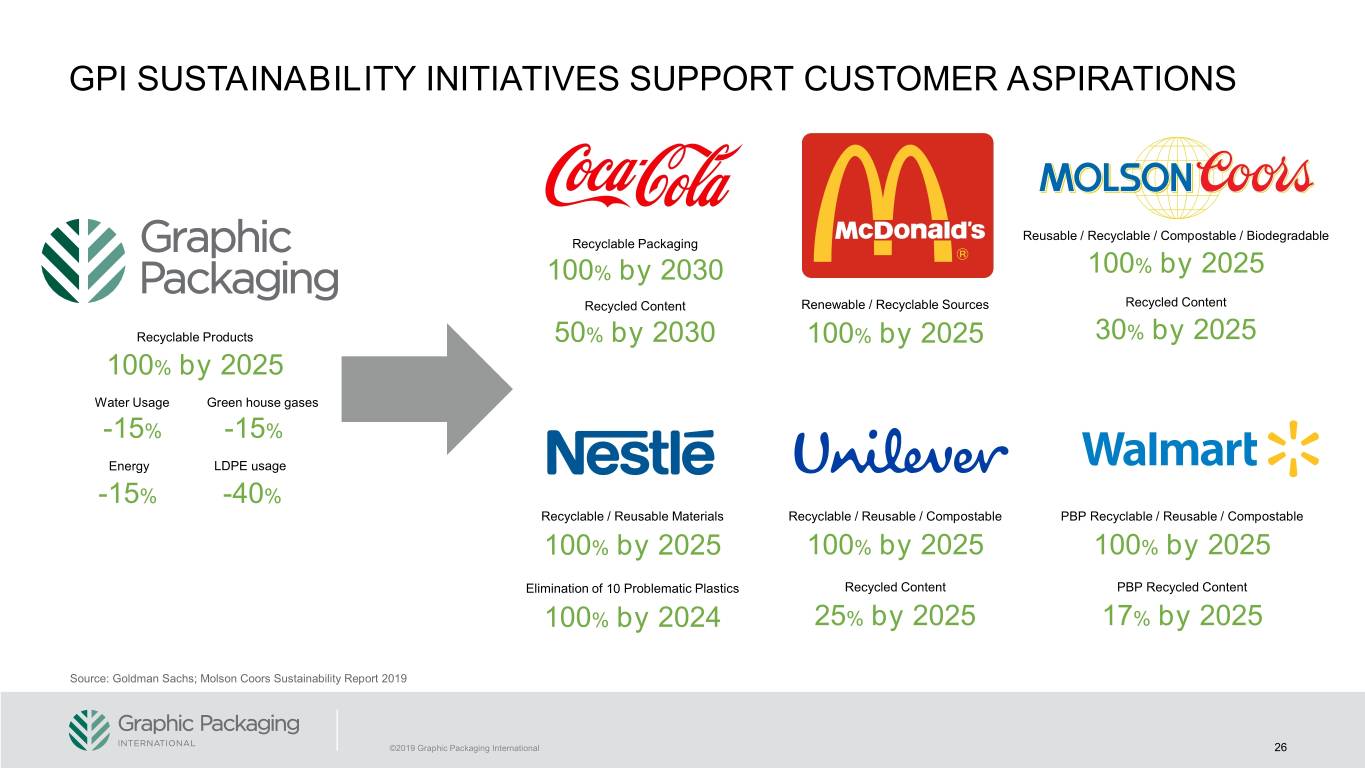
GPI SUSTAINABILITY INITIATIVES SUPPORT CUSTOMER ASPIRATIONS Reusable / Recyclable / Compostable / Biodegradable Recyclable Packaging 100% by 2030 100% by 2025 Recycled Content Renewable / Recyclable Sources Recycled Content Recyclable Products 50% by 2030 100% by 2025 30% by 2025 100% by 2025 Water Usage Green house gases -15% -15% Energy LDPE usage -15% -40% Recyclable / Reusable Materials Recyclable / Reusable / Compostable PBP Recyclable / Reusable / Compostable 100% by 2025 100% by 2025 100% by 2025 Elimination of 10 Problematic Plastics Recycled Content PBP Recycled Content 100% by 2024 25% by 2025 17% by 2025 Source: Goldman Sachs; Molson Coors Sustainability Report 2019 ©2019 Graphic Packaging International 26
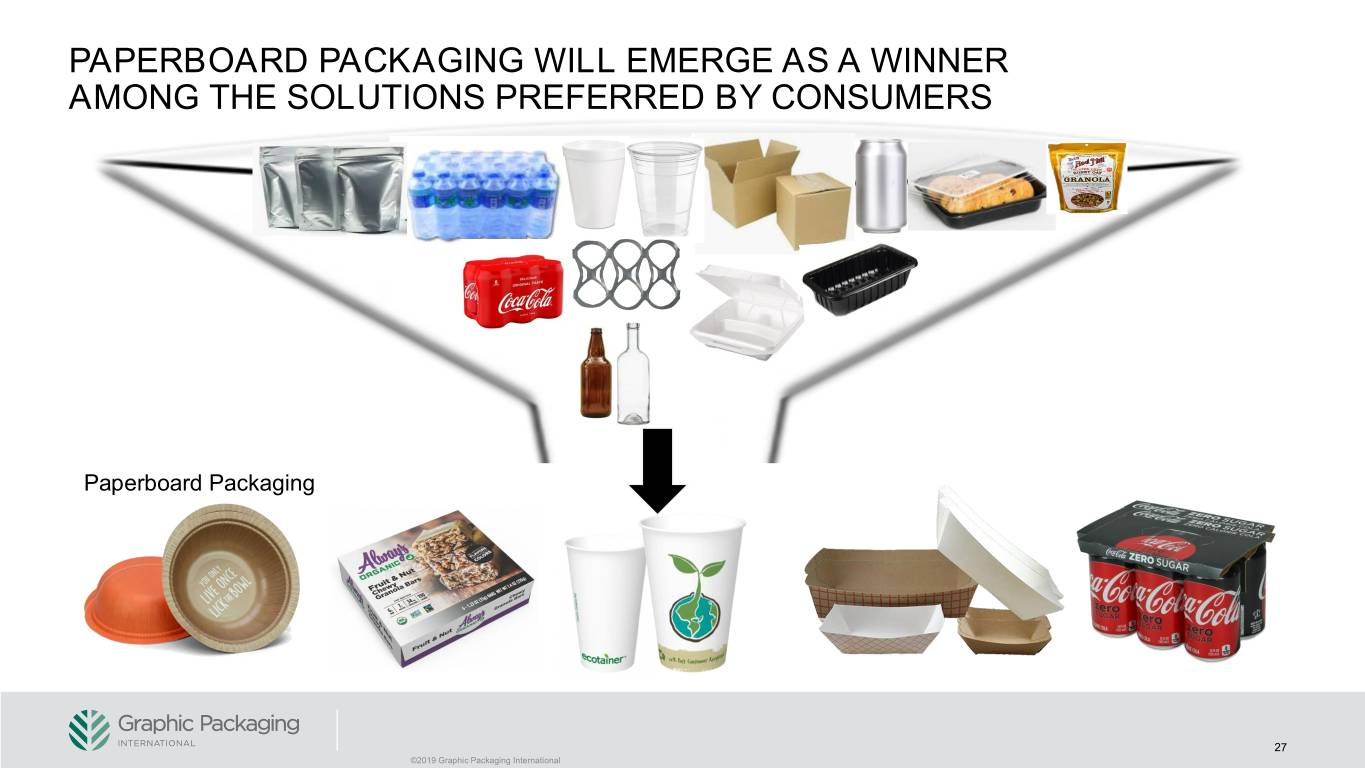
PAPERBOARD PACKAGING WILL EMERGE AS A WINNER AMONG THE SOLUTIONS PREFERRED BY CONSUMERS Paperboard Packaging 27 ©2019 Graphic Packaging International
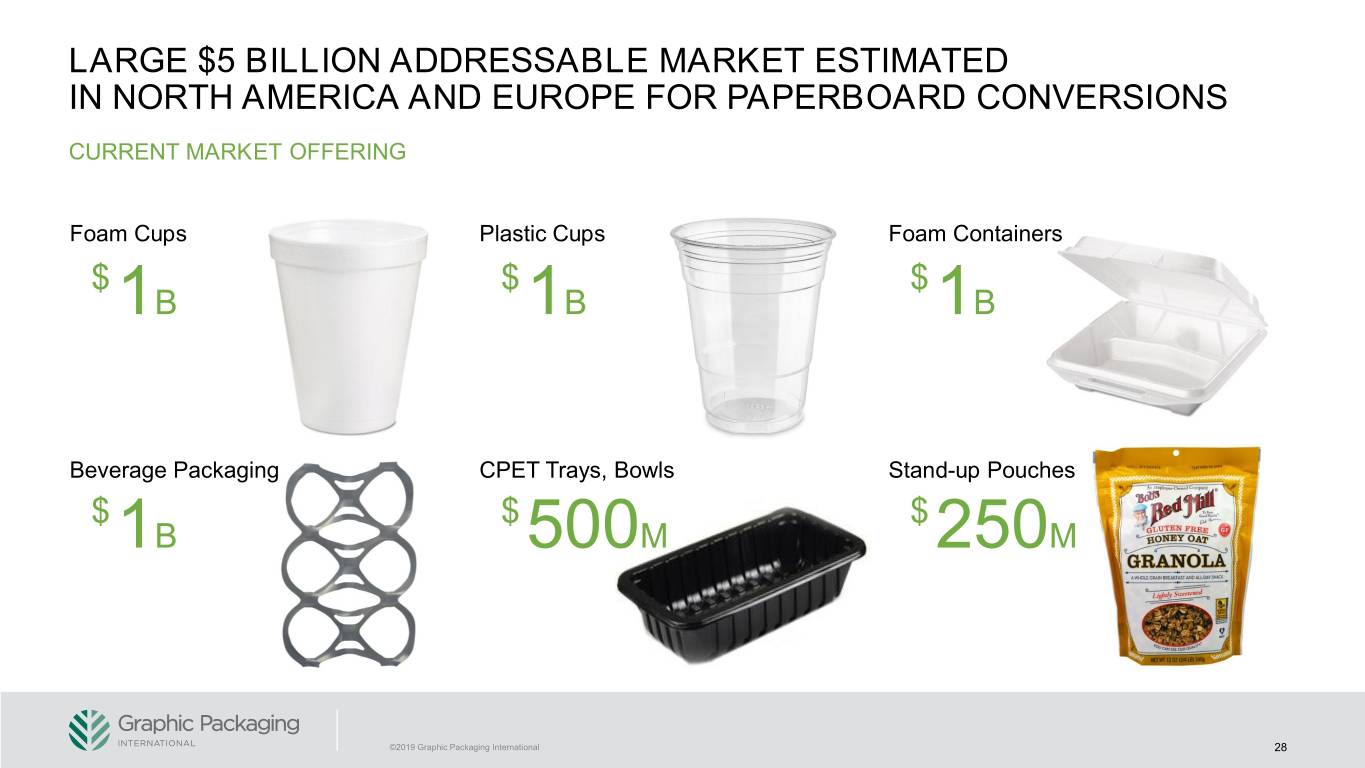
LARGE $5 BILLION ADDRESSABLE MARKET ESTIMATED IN NORTH AMERICA AND EUROPE FOR PAPERBOARD CONVERSIONS CURRENT MARKET OFFERING Foam Cups Plastic Cups Foam Containers $ $ $ 1B 1B 1B Beverage Packaging CPET Trays, Bowls Stand-up Pouches $ $ $ 1B 500M 250M ©2019 Graphic Packaging International 28
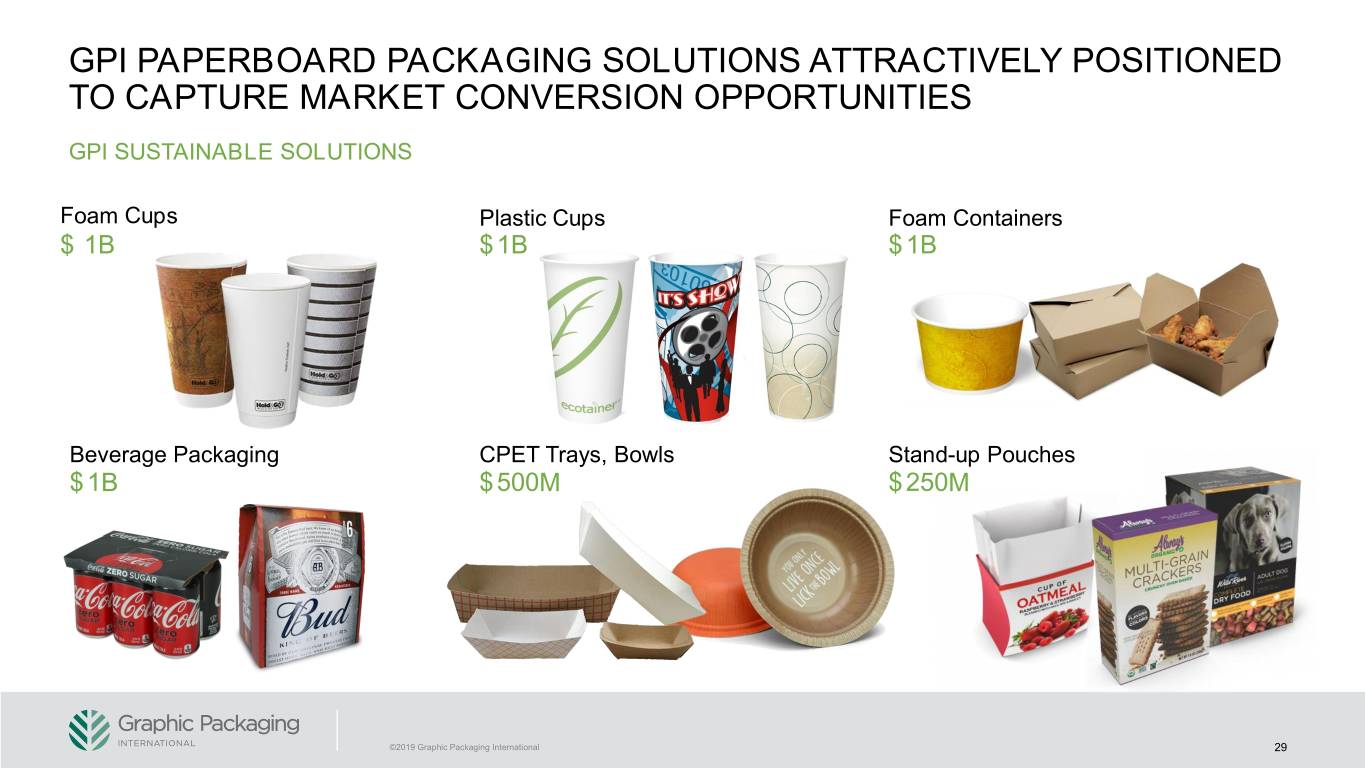
GPI PAPERBOARD PACKAGING SOLUTIONS ATTRACTIVELY POSITIONED TO CAPTURE MARKET CONVERSION OPPORTUNITIES GPI SUSTAINABLE SOLUTIONS Foam Cups Plastic Cups Foam Containers $ 1B $1B $1B Beverage Packaging CPET Trays, Bowls Stand-up Pouches $1B $500M $250M ©2019 Graphic Packaging International 29
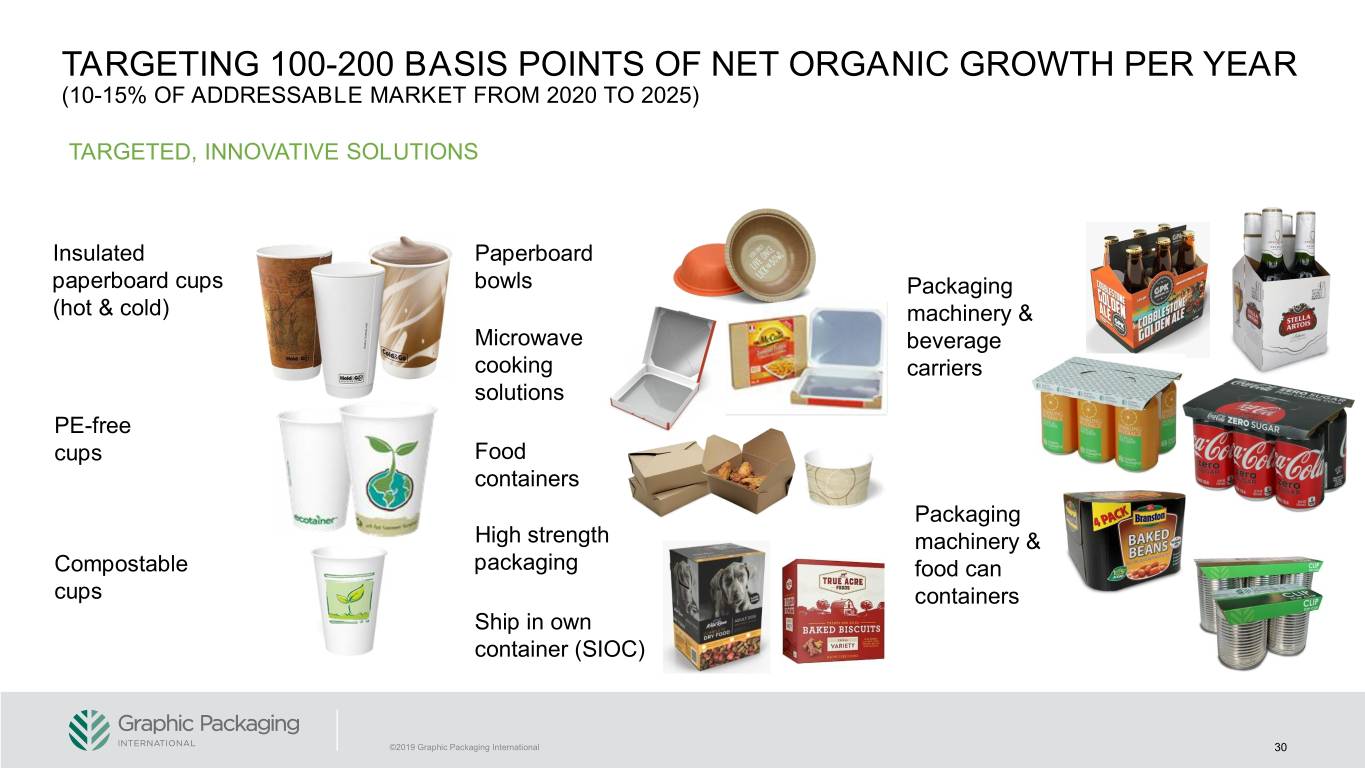
TARGETING 100-200 BASIS POINTS OF NET ORGANIC GROWTH PER YEAR (10-15% OF ADDRESSABLE MARKET FROM 2020 TO 2025) TARGETED, INNOVATIVE SOLUTIONS Insulated Paperboard paperboard cups bowls Packaging (hot & cold) machinery & Microwave beverage cooking carriers solutions PE-free cups Food containers Packaging High strength machinery & Compostable packaging food can cups containers Ship in own container (SIOC) ©2019 Graphic Packaging International 30
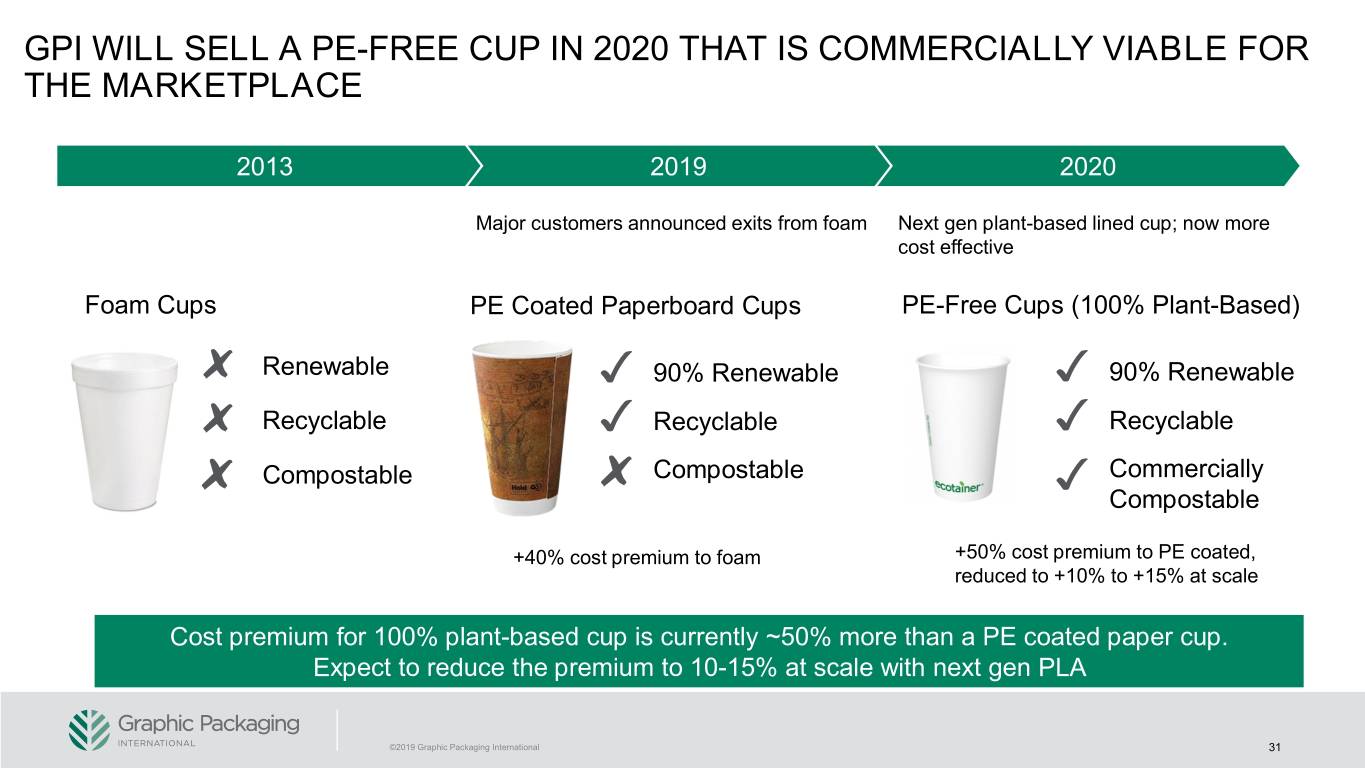
GPI WILL SELL A PE-FREE CUP IN 2020 THAT IS COMMERCIALLY VIABLE FOR THE MARKETPLACE 2013 2019 2020 Major customers announced exits from foam Next gen plant-based lined cup; now more cost effective Foam Cups PE Coated Paperboard Cups PE-Free Cups (100% Plant-Based) Renewable 90% Renewable 90% Renewable Recyclable Recyclable Recyclable Compostable Compostable Commercially Compostable +40% cost premium to foam +50% cost premium to PE coated, reduced to +10% to +15% at scale Cost premium for 100% plant-based cup is currently ~50% more than a PE coated paper cup. Expect to reduce the premium to 10-15% at scale with next gen PLA ©2019 Graphic Packaging International 31
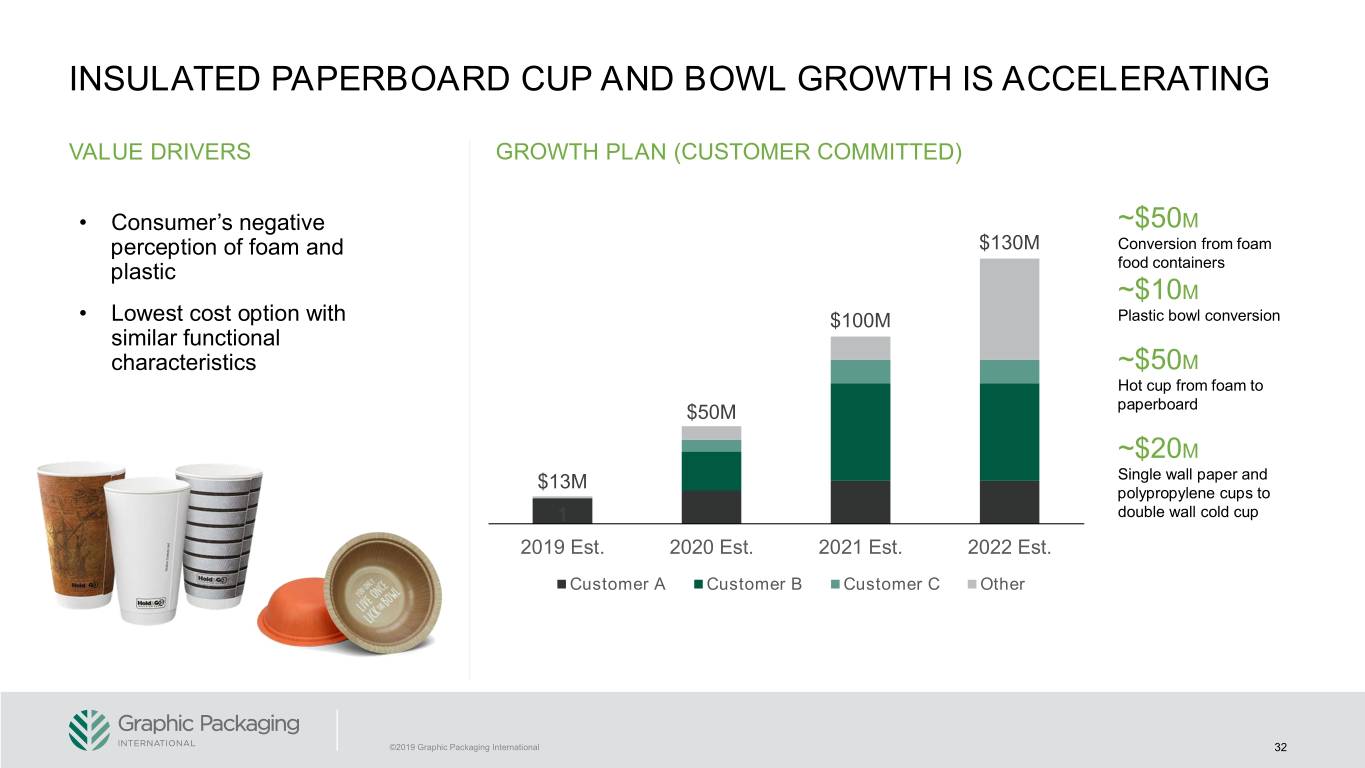
INSULATED PAPERBOARD CUP AND BOWL GROWTH IS ACCELERATING VALUE DRIVERS GROWTH PLAN (CUSTOMER COMMITTED) • Consumer’s negative ~$50M perception of foam and $130M Conversion from foam plastic food containers ~$10M • Lowest cost option with $100M Plastic bowl conversion similar functional characteristics ~$50M Hot cup from foam to $50M paperboard ~$20M $13M Single wall paper and polypropylene cups to 1 double wall cold cup 2019 Est. 2020 Est. 2021 Est. 2022 Est. Customer A Customer B Customer C Other ©2019 Graphic Packaging International 32
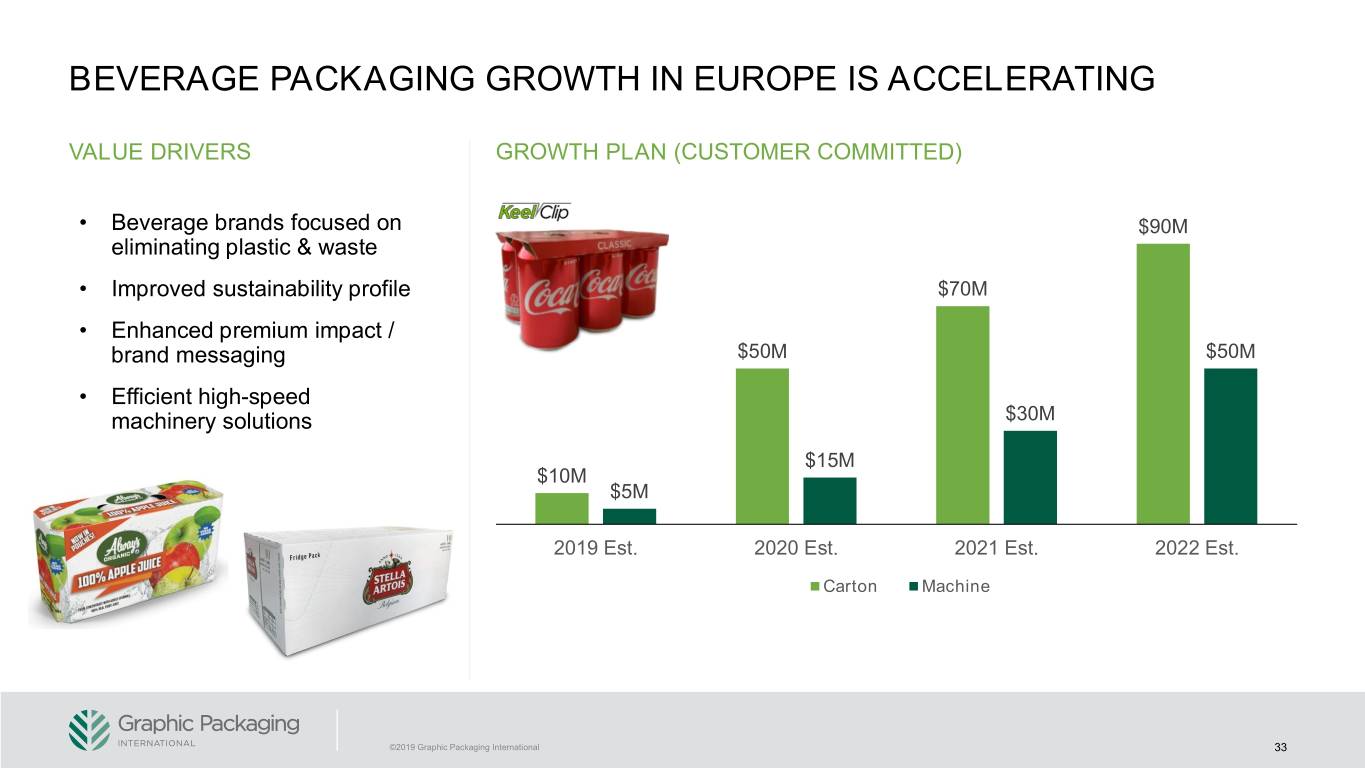
BEVERAGE PACKAGING GROWTH IN EUROPE IS ACCELERATING VALUE DRIVERS GROWTH PLAN (CUSTOMER COMMITTED) • Beverage brands focused on $90M eliminating plastic & waste • Improved sustainability profile $70M • Enhanced premium impact / brand messaging $50M $50M • Efficient high-speed machinery solutions $30M $15M $10M $5M 2019 Est. 2020 Est. 2021 Est. 2022 Est. Carton Machine ©2019 Graphic Packaging International 33
AGENDA Graphic Packaging Today 2019–2020 Financial Update Vision 2025 Sustainability Supported, Organic Growth Productivity Driven Margin Improvement Financial Flexibility ©2019 Graphic Packaging International 34
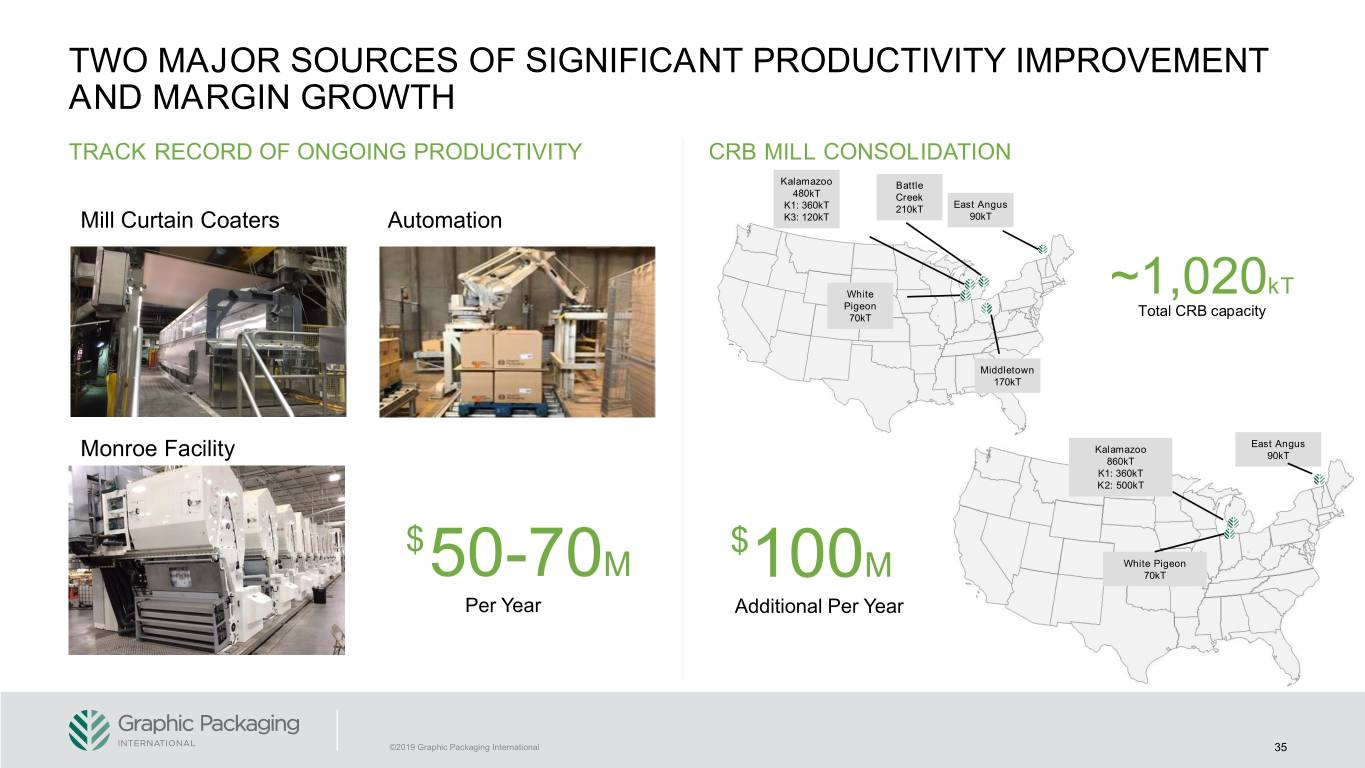
TWO MAJOR SOURCES OF SIGNIFICANT PRODUCTIVITY IMPROVEMENT AND MARGIN GROWTH TRACK RECORD OF ONGOING PRODUCTIVITY CRB MILL CONSOLIDATION Kalamazoo Battle 480kT Creek K1: 360kT 210kT East Angus Mill Curtain Coaters Automation K3: 120kT 90kT White ~1,020kT Pigeon 70kT Total CRB capacity Middletown 170kT East Angus Kalamazoo Monroe Facility 90kT 860kT K1: 360kT K2: 500kT $ $ White Pigeon 50-70M 100M 70kT Per Year Additional Per Year ©2019 Graphic Packaging International 35
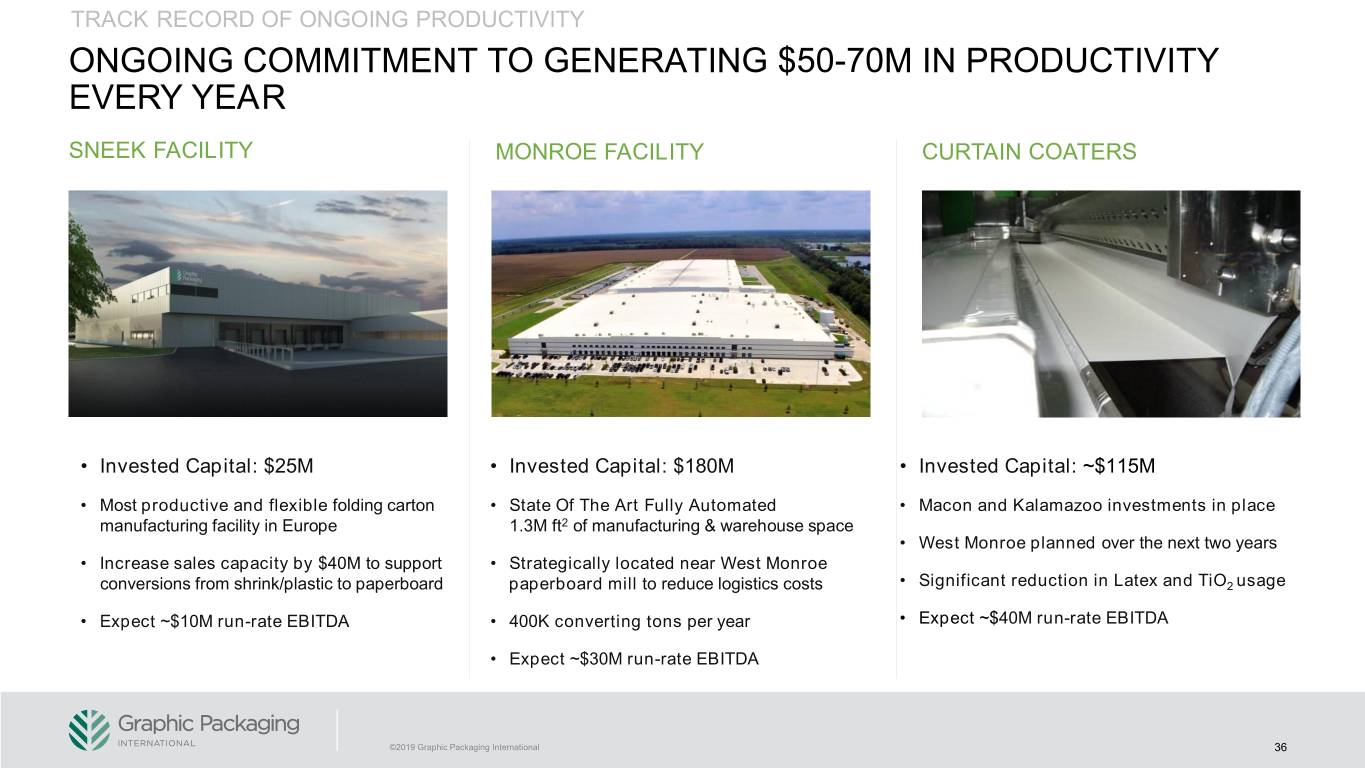
TRACK RECORD OF ONGOING PRODUCTIVITY ONGOING COMMITMENT TO GENERATING $50-70M IN PRODUCTIVITY EVERY YEAR SNEEK FACILITY MONROE FACILITY CURTAIN COATERS • Invested Capital: $25M • Invested Capital: $180M • Invested Capital: ~$115M • Most productive and flexible folding carton • State Of The Art Fully Automated • Macon and Kalamazoo investments in place manufacturing facility in Europe 1.3M ft2 of manufacturing & warehouse space • West Monroe planned over the next two years • Increase sales capacity by $40M to support • Strategically located near West Monroe conversions from shrink/plastic to paperboard paperboard mill to reduce logistics costs • Significant reduction in Latex and TiO2 usage • Expect ~$10M run-rate EBITDA • 400K converting tons per year • Expect ~$40M run-rate EBITDA • Expect ~$30M run-rate EBITDA ©2019 Graphic Packaging International 36
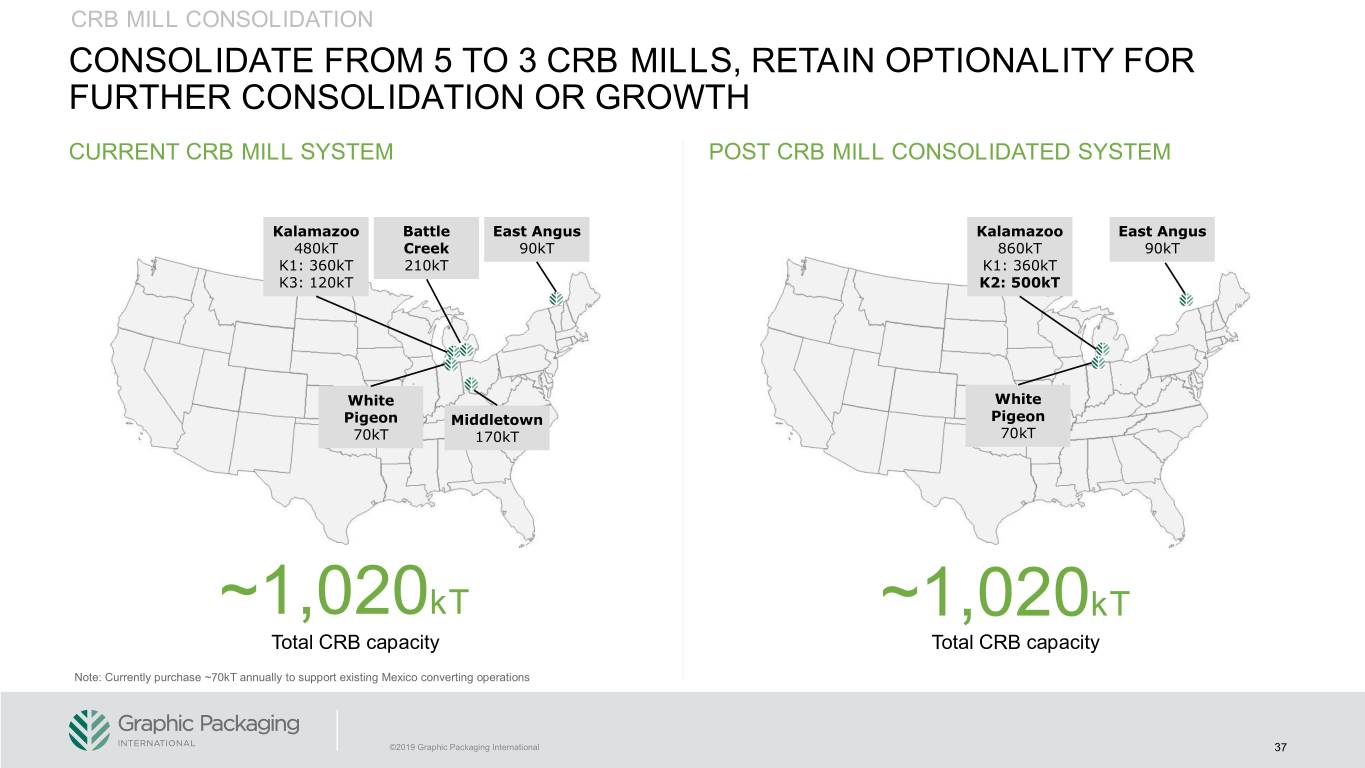
CRB MILL CONSOLIDATION CONSOLIDATE FROM 5 TO 3 CRB MILLS, RETAIN OPTIONALITY FOR FURTHER CONSOLIDATION OR GROWTH CURRENT CRB MILL SYSTEM POST CRB MILL CONSOLIDATED SYSTEM Kalamazoo Battle East Angus Kalamazoo East Angus 480kT Creek 90kT 860kT 90kT K1: 360kT 210kT K1: 360kT K3: 120kT K2: 500kT White White Pigeon Middletown Pigeon 70kT 170kT 70kT ~1,020kT ~1,020kT Total CRB capacity Total CRB capacity Note: Currently purchase ~70kT annually to support existing Mexico converting operations ©2019 Graphic Packaging International 37
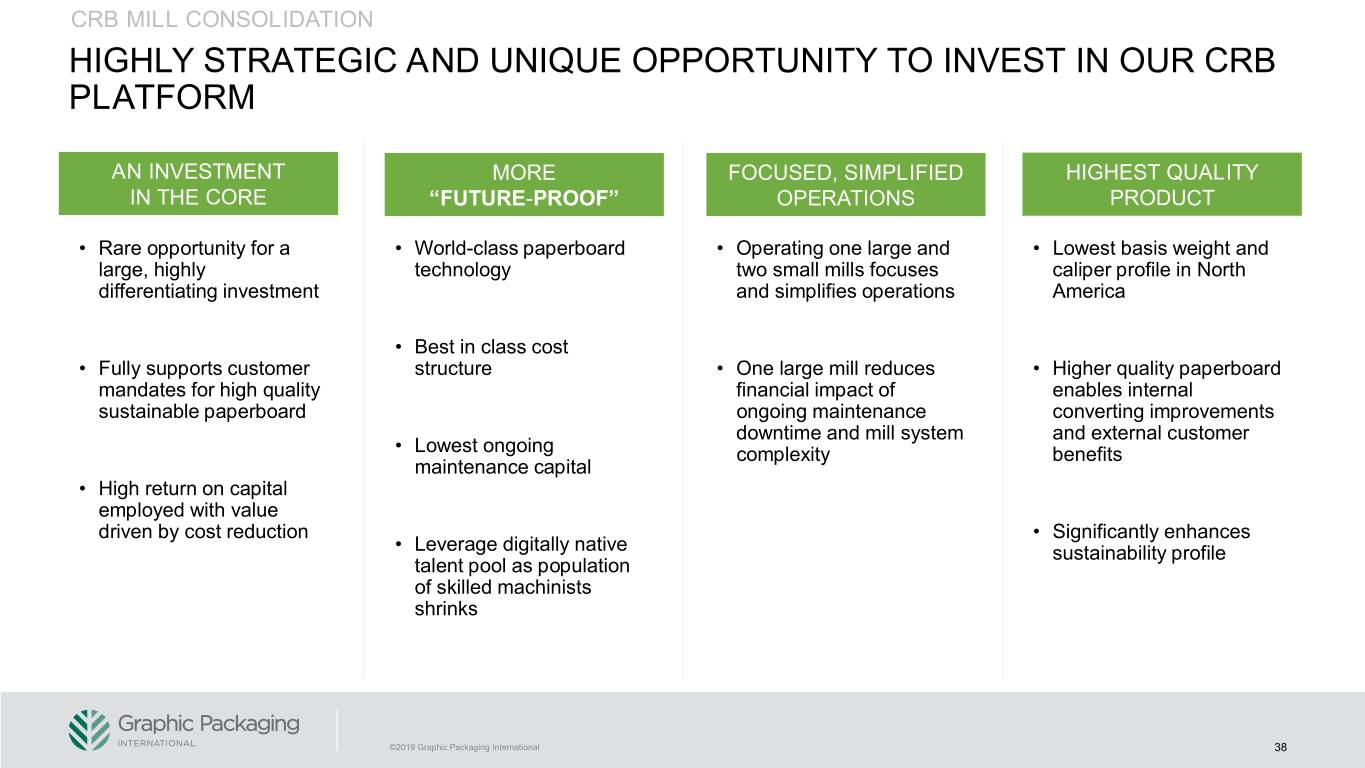
CRB MILL CONSOLIDATION HIGHLY STRATEGIC AND UNIQUE OPPORTUNITY TO INVEST IN OUR CRB PLATFORM AN INVESTMENT MORE FOCUSED, SIMPLIFIED HIGHEST QUALITY IN THE CORE “FUTURE-PROOF” OPERATIONS PRODUCT • Rare opportunity for a • World-class paperboard • Operating one large and • Lowest basis weight and large, highly technology two small mills focuses caliper profile in North differentiating investment and simplifies operations America • Best in class cost • Fully supports customer structure • One large mill reduces • Higher quality paperboard mandates for high quality financial impact of enables internal sustainable paperboard ongoing maintenance converting improvements downtime and mill system and external customer • Lowest ongoing complexity benefits maintenance capital • High return on capital employed with value driven by cost reduction • Significantly enhances • Leverage digitally native sustainability profile talent pool as population of skilled machinists shrinks ©2019 Graphic Packaging International 38
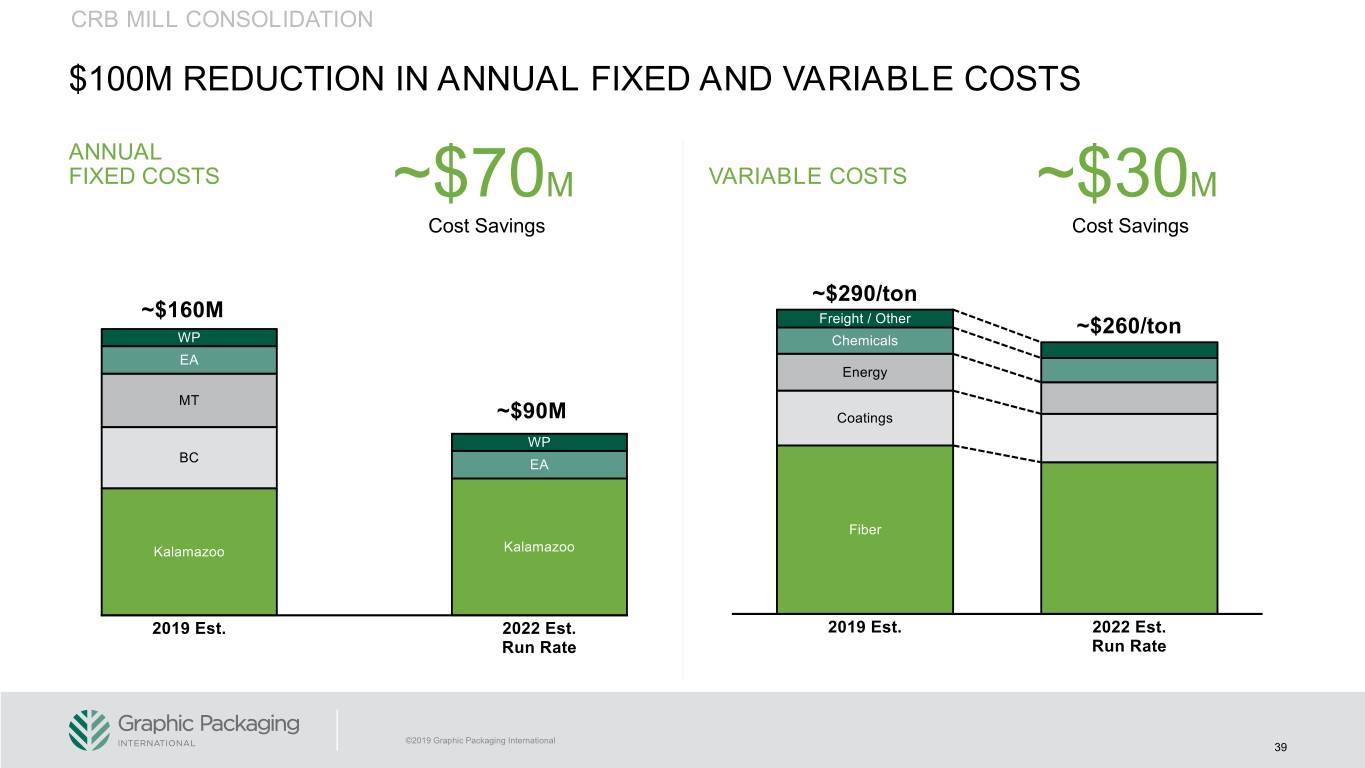
CRB MILL CONSOLIDATION $100M REDUCTION IN ANNUAL FIXED AND VARIABLE COSTS ANNUAL FIXED COSTS ~$70M VARIABLE COSTS ~$30M Cost Savings Cost Savings ©2019 Graphic Packaging International 39
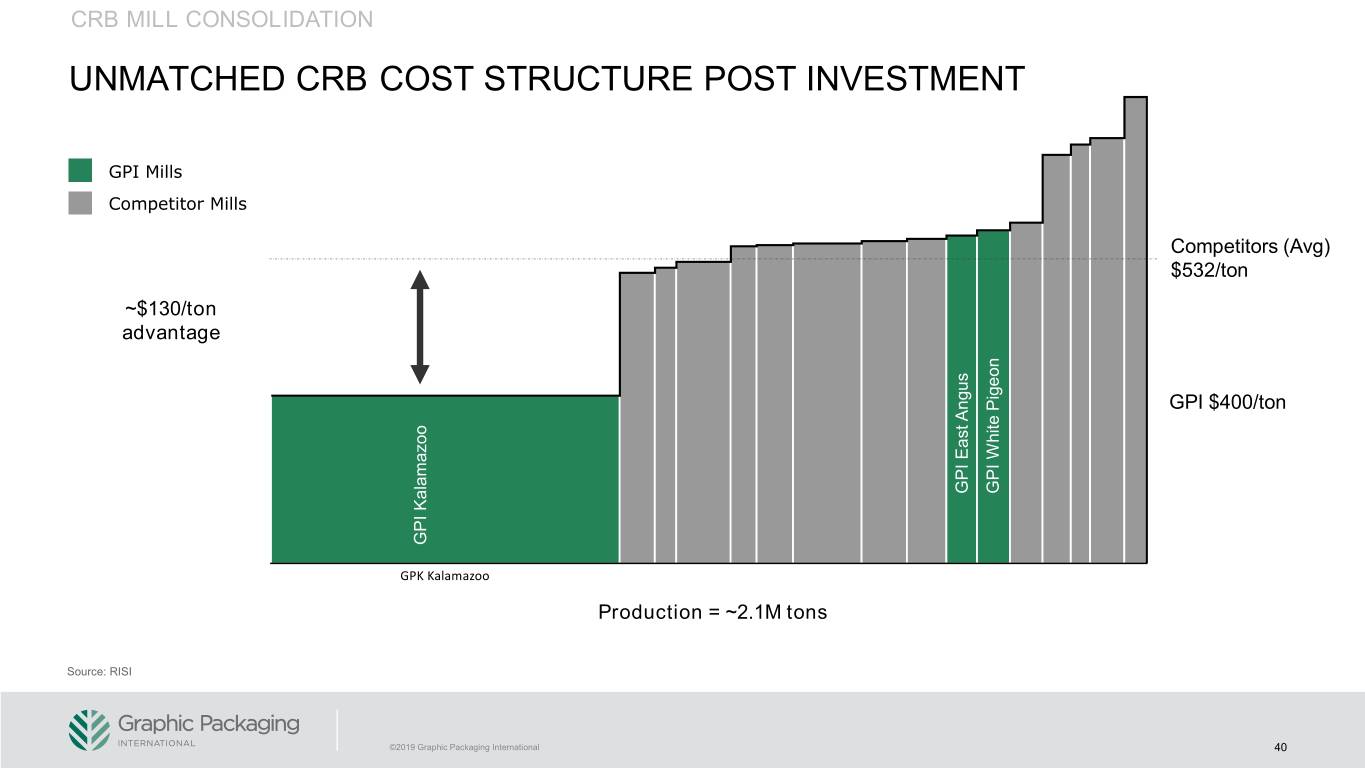
CRB MILL CONSOLIDATION UNMATCHED CRB COST STRUCTURE POST INVESTMENT GPI Mills Competitor Mills Competitors (Avg) $532/ton ~$130/ton advantage GPI $400/ton GPI East Angus GPI East GPI WhitePigeon GPI Kalamazoo Production = ~2.1M tons Source: RISI ©2019 Graphic Packaging International 40
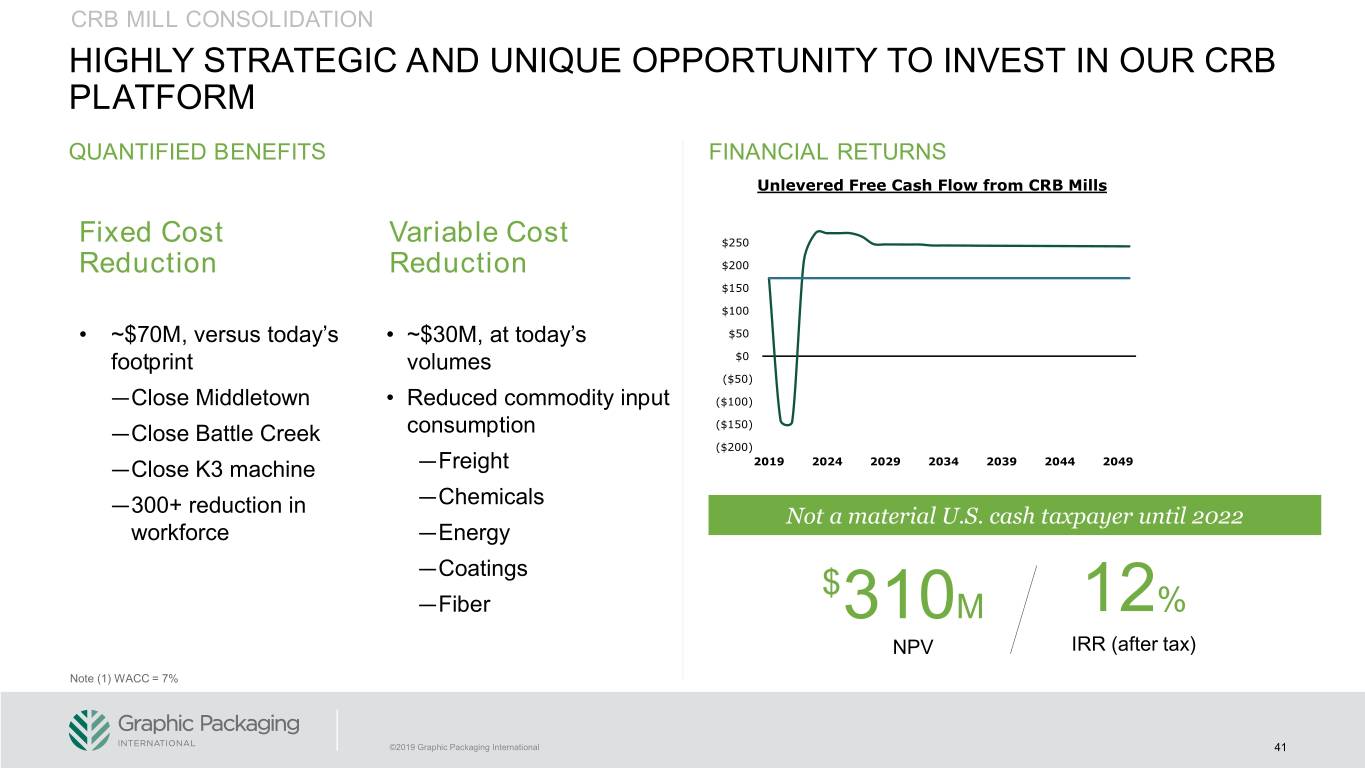
CRB MILL CONSOLIDATION HIGHLY STRATEGIC AND UNIQUE OPPORTUNITY TO INVEST IN OUR CRB PLATFORM QUANTIFIED BENEFITS FINANCIAL RETURNS Unlevered Free Cash Flow from CRB Mills Fixed Cost Variable Cost $250 Reduction Reduction $200 $150 $100 • ~$70M, versus today’s • ~$30M, at today’s $50 footprint volumes $0 ($50) —Close Middletown • Reduced commodity input ($100) —Close Battle Creek consumption ($150) ($200) —Close K3 machine —Freight 2019 2024 2029 2034 2039 2044 2049 —Chemicals —300+ reduction in Not a material U.S. cash taxpayer until 2022 workforce —Energy —Coatings $ —Fiber 310M 12% NPV IRR (after tax) Note (1) WACC = 7% ©2019 Graphic Packaging International 41
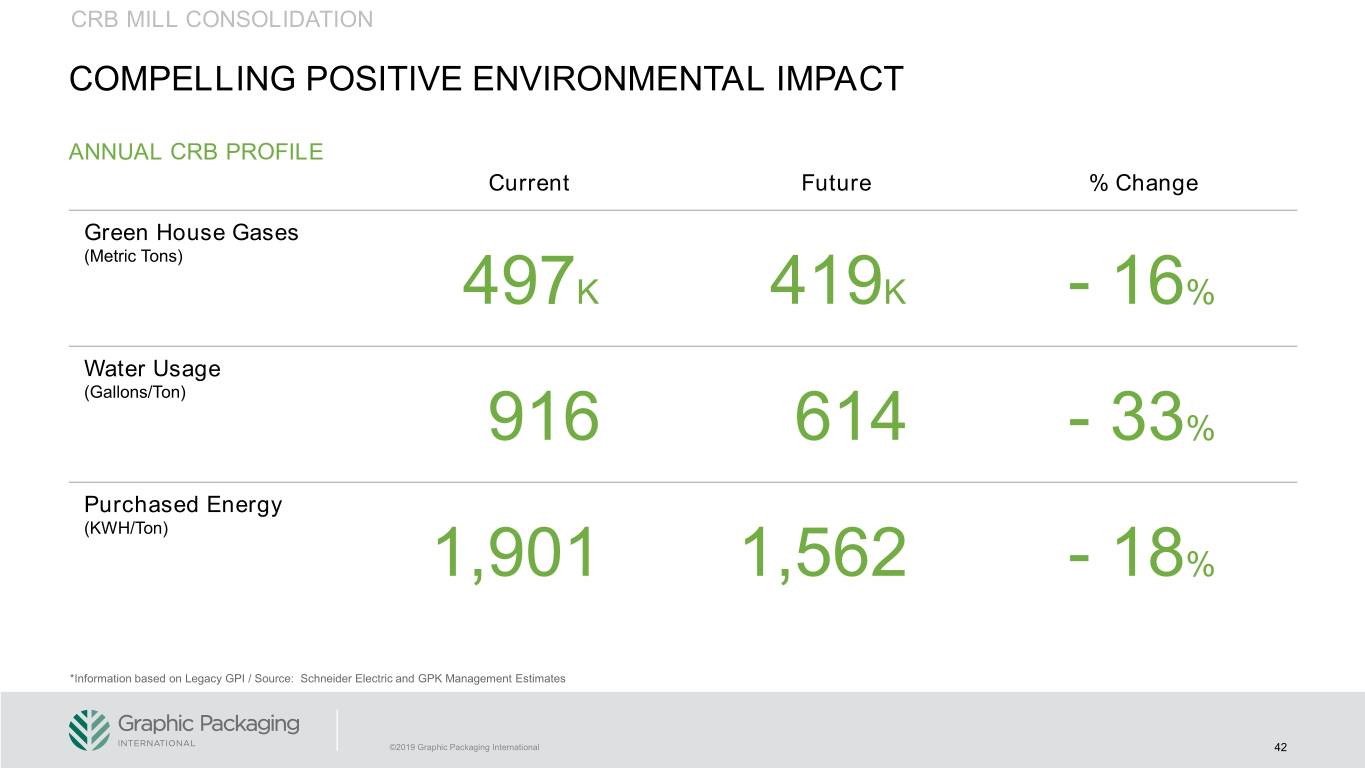
CRB MILL CONSOLIDATION COMPELLING POSITIVE ENVIRONMENTAL IMPACT ANNUAL CRB PROFILE Current Future % Change Green House Gases (Metric Tons) 497K 419K - 16% Water Usage (Gallons/Ton) 916 614 - 33% Purchased Energy (KWH/Ton) 1,901 1,562 - 18% *Information based on Legacy GPI / Source: Schneider Electric and GPK Management Estimates ©2019 Graphic Packaging International 42
AGENDA Graphic Packaging Today 2019–2020 Financial Update Vision 2025 Sustainability Supported, Organic Growth Productivity Driven Margin Improvement Financial Flexibility ©2019 Graphic Packaging International 43
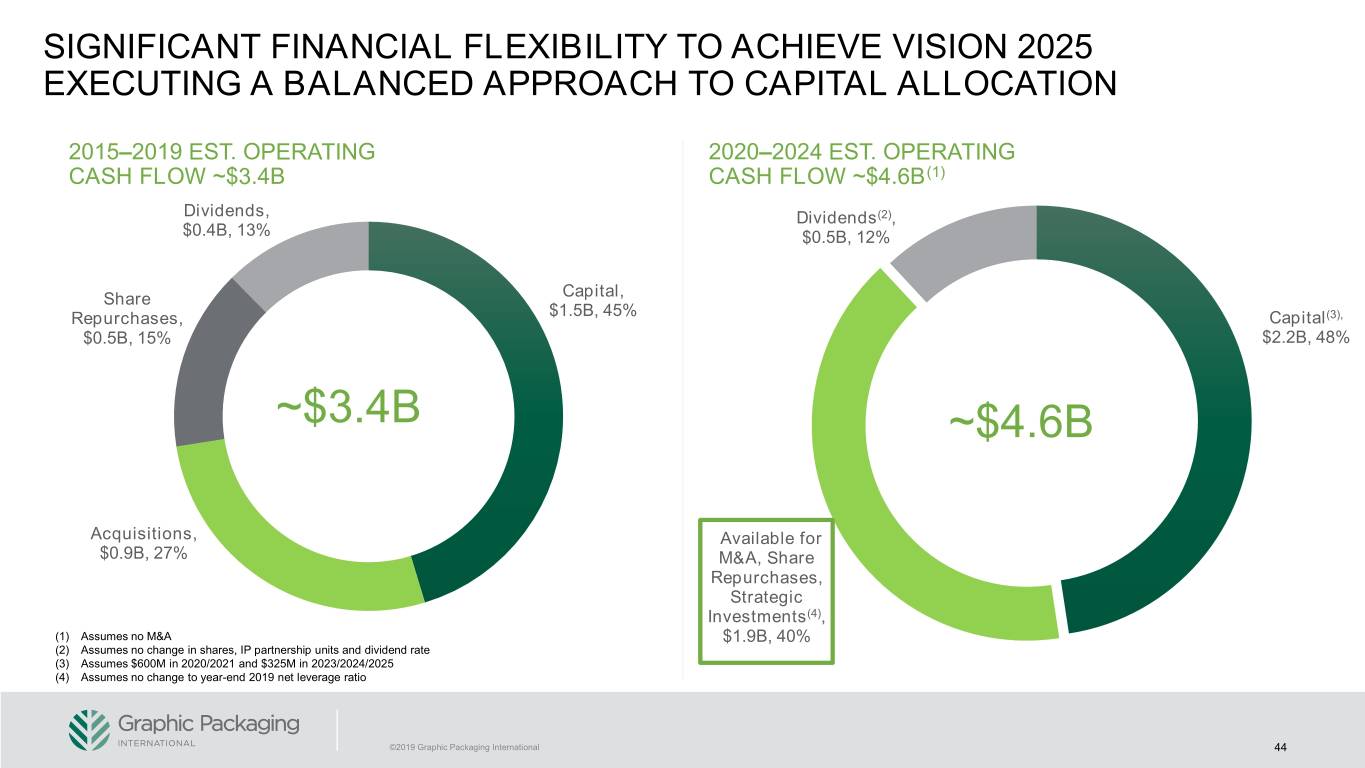
SIGNIFICANT FINANCIAL FLEXIBILITY TO ACHIEVE VISION 2025 EXECUTING A BALANCED APPROACH TO CAPITAL ALLOCATION 2015–2019 EST. OPERATING 2020–2024 EST. OPERATING CASH FLOW ~$3.4B CASH FLOW ~$4.6B(1) Dividends, Dividends(2), $0.4B, 13% $0.5B, 12% Share Capital, Repurchases, $1.5B, 45% Capital(3), $0.5B, 15% $2.2B, 48% ~$3.4B ~$4.6B Acquisitions, Available for $0.9B, 27% M&A, Share Repurchases, Strategic Investments(4), (1) Assumes no M&A $1.9B, 40% (2) Assumes no change in shares, IP partnership units and dividend rate (3) Assumes $600M in 2020/2021 and $325M in 2023/2024/2025 (4) Assumes no change to year-end 2019 net leverage ratio ©2019 Graphic Packaging International 44
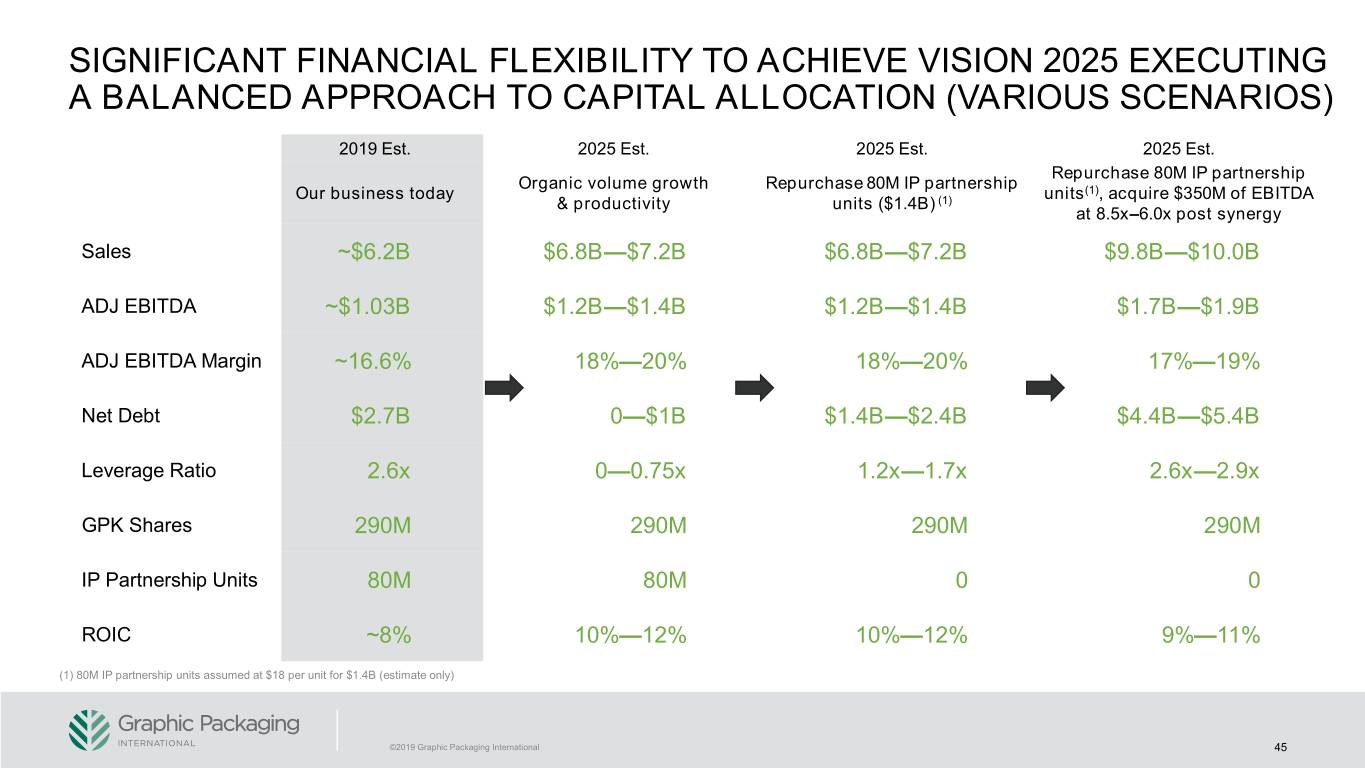
SIGNIFICANT FINANCIAL FLEXIBILITY TO ACHIEVE VISION 2025 EXECUTING A BALANCED APPROACH TO CAPITAL ALLOCATION (VARIOUS SCENARIOS) 2019 Est. 2025 Est. 2025 Est. 2025 Est. Repurchase 80M IP partnership Organic volume growth Repurchase 80M IP partnership Our business today units(1), acquire $350M of EBITDA & productivity units ($1.4B) (1) at 8.5x–6.0x post synergy Sales ~$6.2B $6.8B—$7.2B $6.8B—$7.2B $9.8B—$10.0B ADJ EBITDA ~$1.03B $1.2B—$1.4B $1.2B—$1.4B $1.7B—$1.9B ADJ EBITDA Margin ~16.6% 18%—20% 18%—20% 17%—19% Net Debt $2.7B 0—$1B $1.4B—$2.4B $4.4B—$5.4B Leverage Ratio 2.6x 0—0.75x 1.2x—1.7x 2.6x—2.9x GPK Shares 290M 290M 290M 290M IP Partnership Units 80M 80M 0 0 ROIC ~8% 10%—12% 10%—12% 9%—11% (1) 80M IP partnership units assumed at $18 per unit for $1.4B (estimate only) ©2019 Graphic Packaging International 45
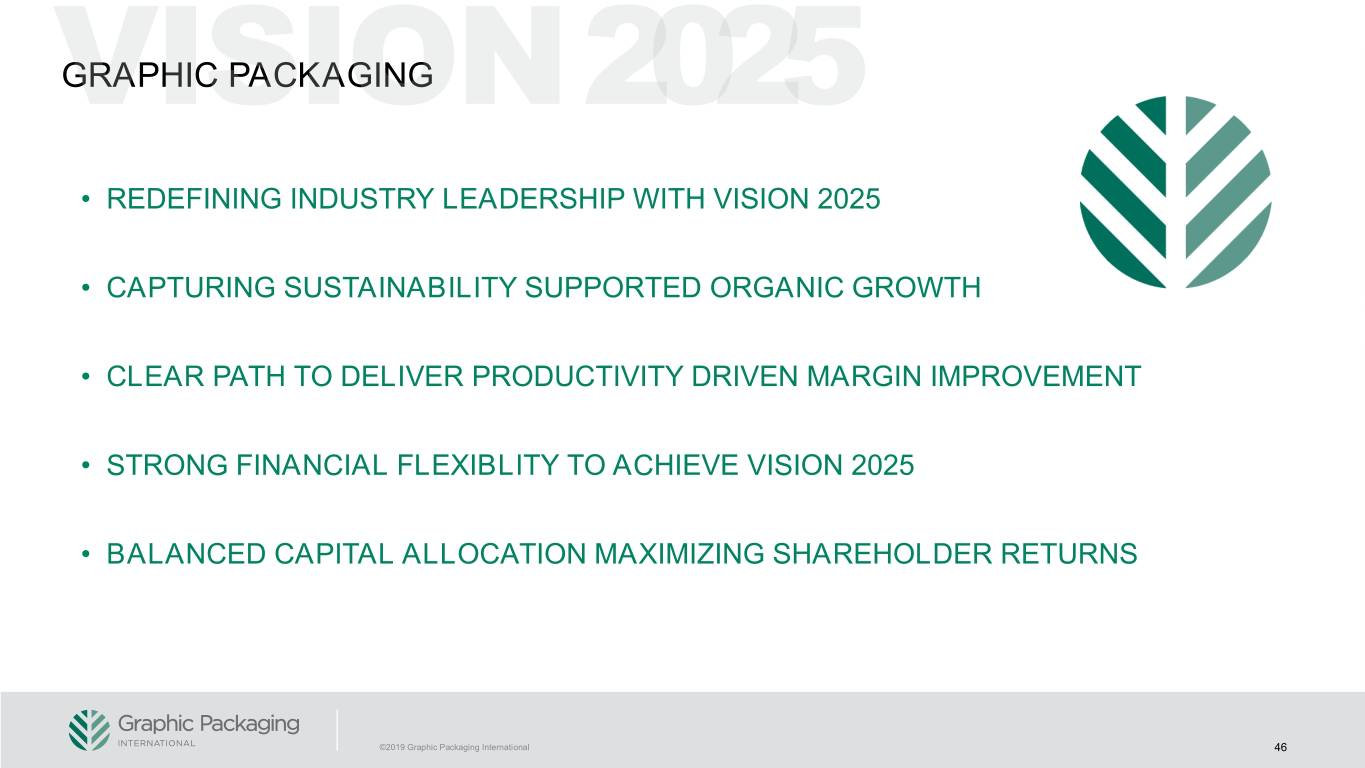
GRAPHIC PACKAGING • REDEFINING INDUSTRY LEADERSHIP WITH VISION 2025 • CAPTURING SUSTAINABILITY SUPPORTED ORGANIC GROWTH • CLEAR PATH TO DELIVER PRODUCTIVITY DRIVEN MARGIN IMPROVEMENT • STRONG FINANCIAL FLEXIBLITY TO ACHIEVE VISION 2025 • BALANCED CAPITAL ALLOCATION MAXIMIZING SHAREHOLDER RETURNS ©2019 Graphic Packaging International 46
APPENDIX ©2019 Graphic Packaging International
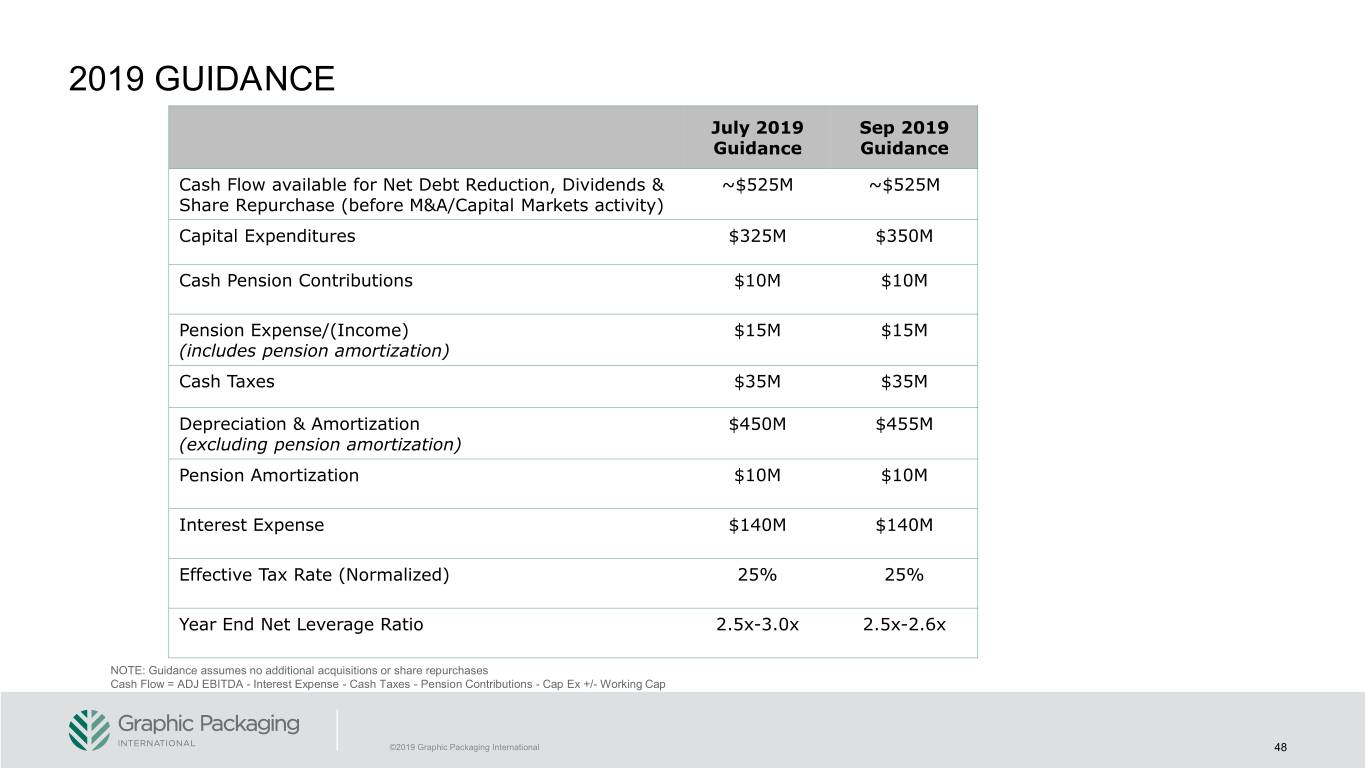
2019 GUIDANCE July 2019 Sep 2019 Guidance Guidance Cash Flow available for Net Debt Reduction, Dividends & ~$525M ~$525M Share Repurchase (before M&A/Capital Markets activity) Capital Expenditures $325M $350M Cash Pension Contributions $10M $10M Pension Expense/(Income) $15M $15M (includes pension amortization) Cash Taxes $35M $35M Depreciation & Amortization $450M $455M (excluding pension amortization) Pension Amortization $10M $10M Interest Expense $140M $140M Effective Tax Rate (Normalized) 25% 25% Year End Net Leverage Ratio 2.5x-3.0x 2.5x-2.6x NOTE: Guidance assumes no additional acquisitions or share repurchases Cash Flow = ADJ EBITDA - Interest Expense - Cash Taxes - Pension Contributions - Cap Ex +/- Working Cap ©2019 Graphic Packaging International 48
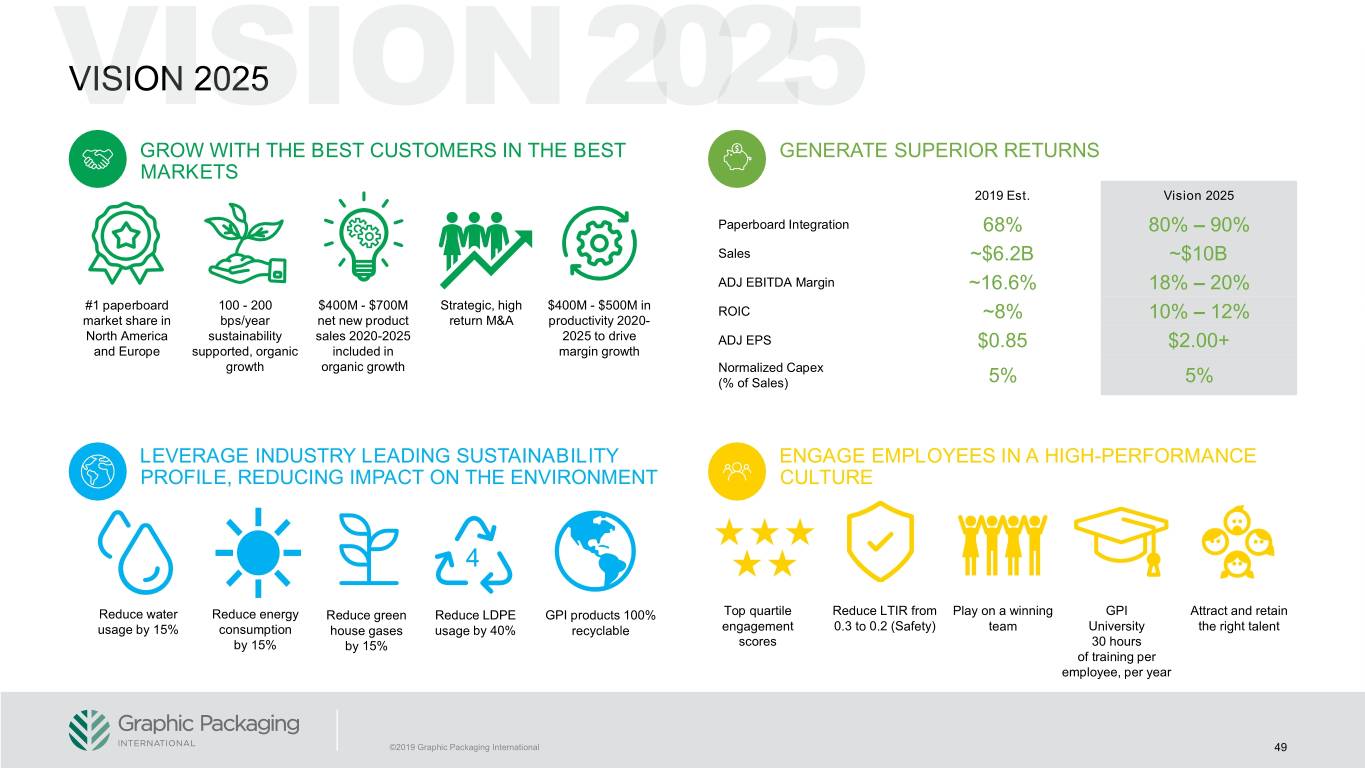
VISION 2025 GROW WITH THE BEST CUSTOMERS IN THE BEST GENERATE SUPERIOR RETURNS MARKETS 2019 Est. Vision 2025 Paperboard Integration 68% 80% – 90% Sales ~$6.2B ~$10B ADJ EBITDA Margin ~16.6% 18% – 20% #1 paperboard 100 - 200 $400M - $700M Strategic, high $400M - $500M in ROIC market share in bps/year net new product return M&A productivity 2020- ~8% 10% – 12% North America sustainability sales 2020-2025 2025 to drive ADJ EPS $0.85 $2.00+ and Europe supported, organic included in margin growth growth organic growth Normalized Capex (% of Sales) 5% 5% LEVERAGE INDUSTRY LEADING SUSTAINABILITY ENGAGE EMPLOYEES IN A HIGH-PERFORMANCE PROFILE, REDUCING IMPACT ON THE ENVIRONMENT CULTURE 4 Reduce water Reduce energy Reduce green Reduce LDPE GPI products 100% Top quartile Reduce LTIR from Play on a winning GPI Attract and retain usage by 15% consumption house gases usage by 40% recyclable engagement 0.3 to 0.2 (Safety) team University the right talent by 15% by 15% scores 30 hours of training per employee, per year ©2019 Graphic Packaging International 49
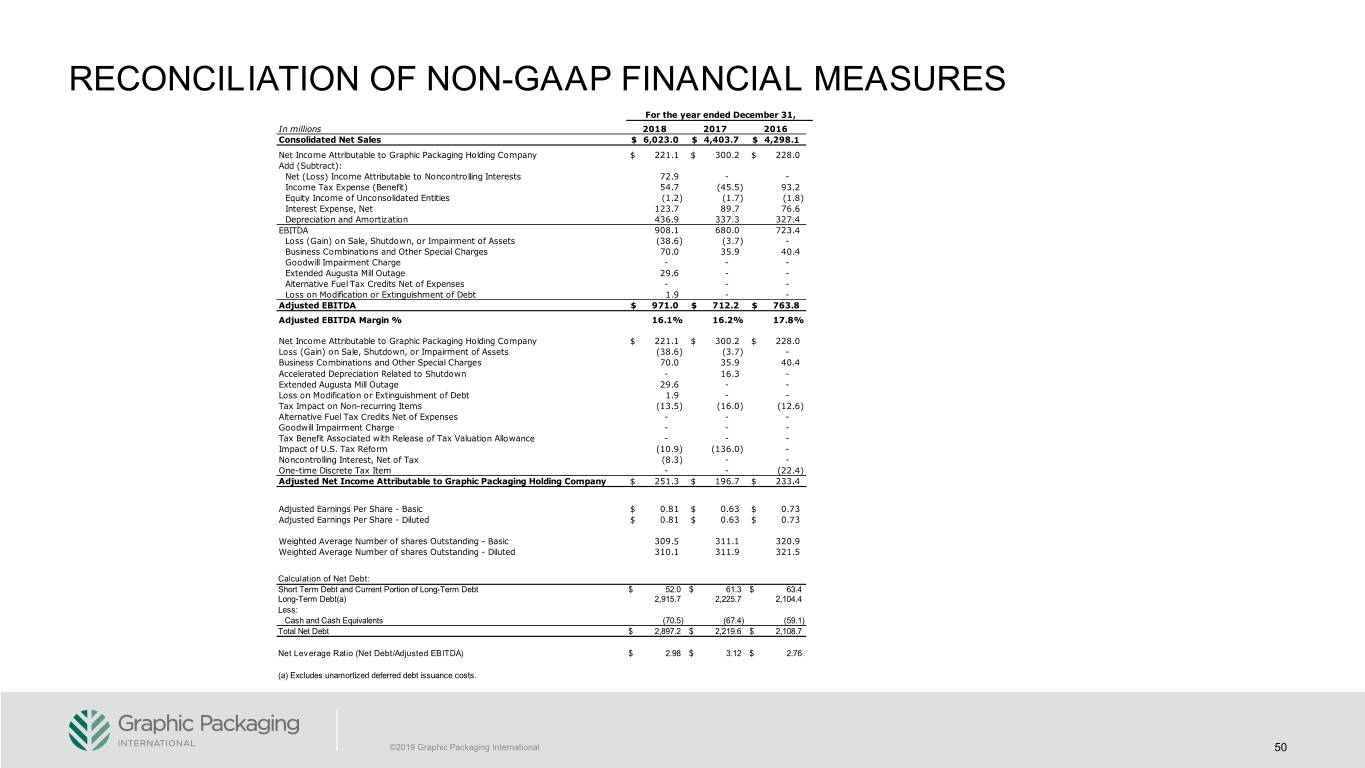
RECONCILIATION OF NON-GAAP FINANCIAL MEASURES For the year ended December 31, In millions 2018 2017 2016 Consolidated Net Sales $ 6,023.0 $ 4,403.7 $ 4,298.1 Net Income Attributable to Graphic Packaging Holding Company $ 221.1 $ 300.2 $ 228.0 Add (Subtract): Net (Loss) Income Attributable to Noncontrolling Interests 72.9 - - Income Tax Expense (Benefit) 54.7 (45.5) 93.2 Equity Income of Unconsolidated Entities (1.2) (1.7) (1.8) Interest Expense, Net 123.7 89.7 76.6 Depreciation and Amortization 436.9 337.3 327.4 EBITDA 908.1 680.0 723.4 Loss (Gain) on Sale, Shutdown, or Impairment of Assets (38.6) (3.7) - Business Combinations and Other Special Charges 70.0 35.9 40.4 Goodwill Impairment Charge - - - Extended Augusta Mill Outage 29.6 - - Alternative Fuel Tax Credits Net of Expenses - - - Loss on Modification or Extinguishment of Debt 1.9 - - Adjusted EBITDA $ 971.0 $ 712.2 $ 763.8 Adjusted EBITDA Margin % 16.1% 16.2% 17.8% Net Income Attributable to Graphic Packaging Holding Company $ 221.1 $ 300.2 $ 228.0 Loss (Gain) on Sale, Shutdown, or Impairment of Assets (38.6) (3.7) - Business Combinations and Other Special Charges 70.0 35.9 40.4 Accelerated Depreciation Related to Shutdown - 16.3 - Extended Augusta Mill Outage 29.6 - - Loss on Modification or Extinguishment of Debt 1.9 - - Tax Impact on Non-recurring Items (13.5) (16.0) (12.6) Alternative Fuel Tax Credits Net of Expenses - - - Goodwill Impairment Charge - - - Tax Benefit Associated with Release of Tax Valuation Allowance - - - Impact of U.S. Tax Reform (10.9) (136.0) - Noncontrolling Interest, Net of Tax (8.3) - - One-time Discrete Tax Item - - (22.4) Adjusted Net Income Attributable to Graphic Packaging Holding Company $ 251.3 $ 196.7 $ 233.4 Adjusted Earnings Per Share - Basic $ 0.81 $ 0.63 $ 0.73 Adjusted Earnings Per Share - Diluted $ 0.81 $ 0.63 $ 0.73 Weighted Average Number of shares Outstanding - Basic 309.5 311.1 320.9 Weighted Average Number of shares Outstanding - Diluted 310.1 311.9 321.5 Calculation of Net Debt: Short Term Debt and Current Portion of Long-Term Debt $ 52.0 $ 61.3 $ 63.4 Long-Term Debt(a) 2,915.7 2,225.7 2,104.4 Less: Cash and Cash Equivalents (70.5) (67.4) (59.1) Total Net Debt $ 2,897.2 $ 2,219.6 $ 2,108.7 Net Leverage Ratio (Net Debt/Adjusted EBITDA) $ 2.98 $ 3.12 $ 2.76 (a) Excludes unamortized deferred debt issuance costs. ©2019 Graphic Packaging International 50
